Geography Reference
In-Depth Information
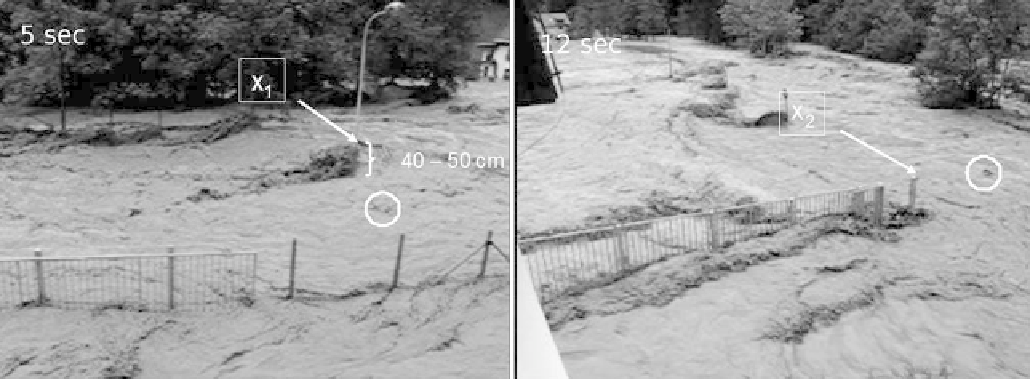
Figure 9.22. Pictures extracted from a movie taken during the 18 September 2007 flood in the Selka Sora catchment (western Slovenia)
at the entrance to Zelezniki. Distance between the sections marked as X
1
and X
2
is 21 m, giving a velocity of 3 m/s in the reach.
From Marchi et al.(
2009
).
estimation. Nevertheless, Cong and Xu (
1987
) showed
that, even if historical data on large floods are affected by
such inevitable errors, this additional information is often
valuable for the purposes of flood frequency analysis.
Besides, it should be noted that even in the case of system-
atic data recorded in gauging stations, river flow data
associated with high magnitude floods suffer from consid-
erable uncertainty caused by errors introduced during
extrapolation of the stage-discharge rating curve (e.g., Di
Baldassarre and Montanari,
2009
). An additional technique
to obtain useful information on past floods is the analysis
of paleo-flood data (Stedinger and Baker,
1987
).
When estimating floods in ungauged basins from histor-
ical flood data or paleo-flood data, techniques are needed
that are able to cope with coarse and irregular information
(Leese,
1973
; Stedinger and Cohn,
1986
; Reis and Stedin-
ger,
2005
). Hence, for this type of data the common
approach is to statistically analyse the river runoff in terms
of exceedances (or non-exceedances) of runoff threshold
values. When working with historic and paleo-flood data,
the hypothesis of stationarity cannot usually be used
because of the effects of human-induced catchment modi-
fications (e.g., dams and channelisation) and natural cli-
matic variability. Hence, the statistical analysis of paleo-
flood data has to explicitly cope with non-stationarity (e.g.,
Benito et al.,
2004
). Micevski and Kuczera (
2009
)
developed a Bayesian approach that can combine at-site
information, such as gauged flows and historic informa-
tion, with information from the regional regression model.
This augmentation with short at-site records is particularly
valuable as uncertainty in regional estimates of the index
flood is particularly severe.
Recent post-event information
Another approach to obtain proxy information on flood
events is by means of post-flood event campaigns. These
field surveys are performed in catchments shortly after
major flood events have occurred (see Section 3.7.3) in
order to identify traces left by the water and sediments.
Flood marks and damage at bridges and other infrastruc-
ture are indicators of the height of the river water
level during the flood event, while patterns of landsliding
or debris flow initiation and deposition provide informa-
tion on the geomorphic response of the catchment.
During these campaigns eyewitness interviews are also
carried out, which can provide useful information on the
timing and magnitude of the flood peak (Marchi et al.,
2009
).
Additional documentation on flood characteristics can
be gathered from photographs and movies recorded
during the flood. Floodwater velocity can be obtained
and compared with computations of flow velocity from
hydraulic models. In
Figure 9.22
the velocity of a
floating object is approximately estimated by timing the
passage of the object, which was visible on the movie,
between landmarks a known distance apart. Borga et al.
(
2008
) have shown how this information can be used to
carefully reconstruct peak runoff.
Figure 9.17
illustrated
the importance of collecting information on major events
in ungauged catchments.
Figure 9.17b
shows that in
more than half of the cases, 80% of the data for basins
less than 100 km
2
were collected by means of post-flood
surveys, following the methodology described in Borga
et al.(
2008
). These proportions identify the observa-
tional problem that characterises flash floods, which is
Search WWH ::

Custom Search