Geography Reference
In-Depth Information
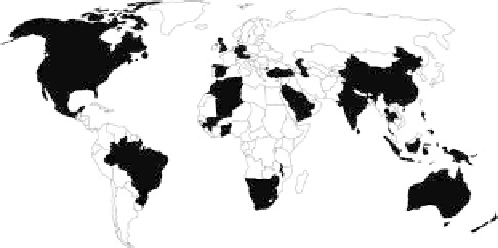
Figure 9.24. Map indicating the countries included in the Level 1
assessment. After Salinas et al.(
2013
).
Figure 9.25. Root mean square normalised error (RMSNE) of
predicting the 100-year floods in ungauged basins stratified by
climate. Each symbol refers to a result from the studies in
Table A9.1
.
Circles indicate cross-validation performance on specific values,
crosses indicate cross-validation performance on volumes. Boxes
show 25%
depends on climate and catchment characteristics as well as
on the method chosen. More details on the comparative
study are reported in Salinas et al.(
2013
). In both Level 1
and Level 2 assessments, the runoff prediction performance
was evaluated by leave-one-out cross-validation, where
each catchment was treated as ungauged and the runoff
predictions were then compared to the observed runoff.
The runoff prediction performances obtained by the com-
parative assessment are estimates of the total uncertainty of
runoff predictions in these ungauged basins.
-
75% quantiles. After Salinas et al.(
2013
).
studies from South America, Africa and Asia were also
available. With respect to climate, it is apparent that evalu-
ations in cold regions dominate. There were only a few
studies in mountain regions, which were combined with
the cold and humid regions in the analyses. Three main
science questions are addressed below.
9.5.1 Level 1 assessment
Table A9.1
(Appendix) summarises the 31 individual stud-
ies used in the Level 1 assessment. Many of these studies
are based on large data sets providing a broad range of
results from catchments in different climates. The number
of catchments evaluated in the studies ranges from 8 to
600, with a median of 29. Several studies compare differ-
ent regionalisation approaches or use different sub-regions
for the assessment. Removal of these leads to a total of 49
results for evaluating runoff prediction performance. The
regionalisation methods used are regression approaches,
index methods and geostatistics. In the majority of the
studies performance is specified as root mean square nor-
malised error (RMSNE, Table 2.2) on the 100-year flood
quantile or the 100-year specific flood quantile. Note that
RMSNE represents errors (rather than skill), so it has been
plotted downwards on the vertical axis to make it consist-
ent with the performance measures in the other chapters,
i.e. higher up in the plot indicates better performance. For
comparison with the other runoff signatures in
Chapter 12
,
the R
2
of the 100-year flood quantile for all methods in all
studies were back-calculated from the RMSNE by apply-
ing an empirical relationship from Level 2. The 25% and
75% quantiles of these R
2
are 0.41 and 0.70, respectively.
Figure 9.24
and
Table A9.1
show that most of the
studies came from Europe and North America, but a few
How good are the predictions in different climates?
Figure 9.25
shows that runoff predictions in the humid
regions exhibit smaller errors than runoff prediction in arid
regions. This means that the predictive performance clearly
decreases with increasing aridity. There are a number of
factors that may contribute to this dependence. The inter-
annual variability (e.g., in terms of CV of the annual peak
runoff time series) of floods in arid regions is usually
bigger than in other climates, due to the associated stronger
non-linearities and threshold effects in drier regions. This
means that the floods are more difficult to estimate from
short records. The stronger non-linearity also implies that
the spatial hydrological variability in the flood-producing
processes will impact more strongly on the flood frequency
curve, so even catchments that are close to each other may
exhibit quite different flood frequency curves, which
reflects poorly on the regionalised predictions. In contrast,
humid catchments tend to be more linear, so the predict-
ability is better.
The biggest range of performances is found in cold
climates. This may be partly related to the larger number
of studies available for these regions. Also, in cold regions
a wide variety of flood-producing processes may exist,
including snow and rain-on-snow, which may lead to dif-
ferent performance, depending on the prevailing processes.

Search WWH ::

Custom Search