Information Technology Reference
In-Depth Information
hysteretic nature of the devices themselves (Fig. 11.11), the same trend in the
change of V
T
was observed. The control samples experienced the same treatment
history as the devices under test, but had no molecules grafted on them, only the
hydrogen passivation remained. For control samples, the V
T
changed slightly
(typically
0.3 V) from the first to the second etching. This supports our assertion
that the V
T
change in the devices under test is not caused by the etching but by the
molecular grafting on the channel region which tracks directly with the electron
donor ability of the molecules. The changes in V
T
after the monolayer molecular
grafting are consistent with those in I
D
. Attaching compounds 1-3 led to a more
negative V
T
and less I
D
while attaching 4 resulted in a less negative V
T
and larger
I
D
. Therefore the channel conductances were reduced by grafting molecular
monolayers of 1-3, and they were increased by 4, scaling directly with the relative
electron donating ability of the molecules.
From the charge perspective, molecular grafting changes the channel con-
ductance in a way similar to the impurity doping. The acceptor-like monolayer
(more potent than the hydrogen atom of the H-passivated control) would decrease
the V
T
of the pseudo-MOSFET and the donors would increase the V
T
. It implies
that p-Si gained negative charges when modified by compounds 1-3, while it gave
up negative charges in the case of 4.
r
α
β
−
1E-5
−
4E-5
0.008
1
−
5E-6
−
2E-5
0
0
0.006
0
4
−
4
−
8
−
2
−
1
−
2
−
3
−
4
−
5
0
0
V
g
(V)
V
D
(V)
Control
0.004
−
1
3
0.002
−
2
2
V
T
=
−
5.6 V
1
0.000
−
3
−
−
−
−
−
−
−
0
2
4
6
8
10
12
14
Increasing Relative Electron
Donor Ability of Grafted Molecules
(b)
V
g
(V)
(a)
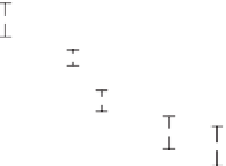
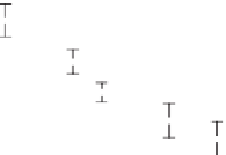
Figure
11.12.
Electrical output results of the pseudo-MOSFET devices. (a) Extra-
polation method for V
T
used on the measured I
D,Sat
0.5
-V
g
characteristics. V
T
was
extracted at its maximum slope point. Inset a displays the typical transfer
characteristics of the devices under test with an applied drain-source bias (V
D
)
of 5V. Such a V
D
waschosenfortheV
T
extraction according to Inset b,the
typical output characteristics of the devices under test at V
g
W
V
T
, to ensure the
device operation is in the saturation region (Supporting Information). (b)
Representative DV
T
(=V
T (with molecules)
- V
T (without molecules)
) of the devices under
test extracted from both the forward (solid circle) and back (solid square) scans
after the grafting of different molecular monolayers (1-4), as well as on the
control samples. Data shown here is the average value for 14 devices.


Search WWH ::

Custom Search