Environmental Engineering Reference
In-Depth Information
Table 7.9 Moisture Flux Conditions Applied to Slope Models
Rainfall
Evaporation
Name of
Name of
Intensity
Duration
Mode of
Measured Potential
Duration
Model
Test
(mm/h)
(mm/h)
Evaporation
Evaporation (mm/h)
(h)
SM1
SM1 T1
8.95
3
Ambient condition
0.02
475
SM1 T2
9.01
3
Lamp
0.20
120
SM1 T3
8.88
3
Fan
0.12
120
SM1 T4
9.04
3
Lamp and fan
0.22
80
SM1
SM2 T1
9.68
3
Lamp and fan
0.43
100
SM2 T2
10.09
3
Ambient condition
0.02
120
SM2 T3
9.88
3
Lamp
0.19
120
SM2 T4
9.85
6
Lamp and fan
0.52
120
used in the slope models. The instantaneous profile method
was used to obtain the permeability function during dry-
ing processes. Water flowed upward from the bottom of
the upper layers during the drying process. Pore-water pres-
sure data from tensiometers T-23, T-24, T-33, T-34, T-43,
and T-44 (see Fig. 7.38) were used for the calculation of
the drying permeability functions. Volumetric water con-
tents were computed based on the SWCC and measured
pore-water pressures (Fig. 7.39). Table 7.8 summarizes the
unsaturated soil parameters used for the calculation of unsat-
urated coefficient of permeability by the instantaneous pro-
file method. The unsaturated coefficients of permeability
k
w
of RS and MRF 60-40 were plotted against corresponding
matric suctions and are shown in Figs. 7.40 and 7.41.
The unsaturated coefficient-of-permeability functions were
also computed using a statistical estimation method described
by Childs and Collis-George (1950). The calculation of the
permeability function requires the saturated coefficient of
permeability and SWCC. The saturated coefficient of perme-
ability of the RS was 9
10
−
7
m/s. The MRF 60-40 soil had
a saturated coefficient of permeability of 5
×
10
−
6
m/s. These
values appear to be about one order of magnitude higher than
the saturated coefficient of permeability obtained from the
independent falling-head tests (Table 7.7).
The instantaneous profile method and the statistical esti-
mation method were used to obtain permeability functions
for the RS and the MRF 60-40, comprising the slope mod-
els. The estimated permeability functions appeared to pro-
vide a reasonable representation of the actual permeability
×
-7
T-24
t
= 4 d
-6
-5
-4
t
= 3 d
-3
T-23
t
= 2 d
-2
-1
t
= 1 d
0
0.00
0.05
0.10
0.15
0.20
Depth (
z
), m
Datum, z = 0
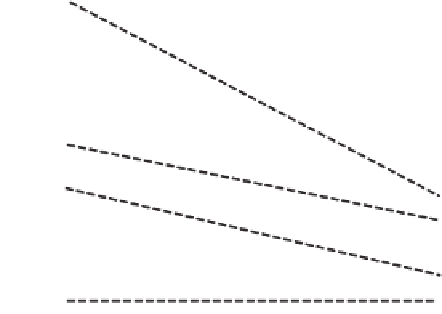
Figure 7.38
Hydraulic head profiles for Test SM1-T1 measured by tensiometers T-23 and T-24
during drying process (after Krisdani et al., 2009).


Search WWH ::

Custom Search