Agriculture Reference
In-Depth Information
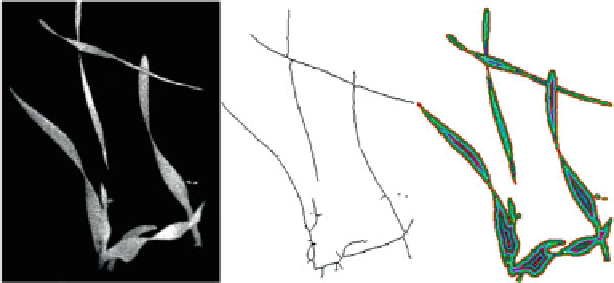
Fig. 10.7
Gray level image of an object with - from
left
to
right
- overlapping leafs, skeleton and
distance transform (Weis and Gerhards
2007
)
The
skeleton
is the “middle line” of the objects as shown in Fig.
10.7
, center. A
distance transform is computed for the leafs, assigning each pixel a value for the
minimum distance to the border of the leaf (Fig.
10.7
right). All border pixels have
the value one, all others inside the region get a higher value. The combination of the
skeleton with the distance transform leads to a distance function that describes the
“thickness” of the leaves. Statistical values (maximum, mean, variance, number of
skeleton pixels) can be derived which were found to discriminate especially grasses
from broadleafs.
Every
feature set
, consisting of more than a 100 features, is associated with a
class. The class assignments are determined from training sets of images. To be able
to reuse the training sets, all training samples are stored in a database. The database
contains the segmented images and the feature sets as well as the class assignments.
A few examples of the images stored in the database are shown in Fig.
10.8
.
A n
image database
was created for six crops (sugar beet, wheat, barley, maize,
peas and oil seed rape) and 40 weed species. In the database, prototypes for the dif-
ferent classes are stored. The images are split up into segments each containing only
one plant of known class. This allows the images to be re-used for the development
of new feature extraction algorithms and classifi ers. A comparison of different image
segmentation approaches and feature sets can be achieved using the database.
10.2.3.2
Identifi cation Results and the Classifi cation of Plant Species
For the identifi cation of weed species, a knowledge-based image analysis system
was used (Gerhards and Oebel
2006
; Oebel et al.
2004
; Sökefeld and Gerhards
2004
). First, shape features were extracted and calculated from all plants in the
image. Those features were used to discriminate and classify plant species. In order
to test the accuracy of the
classifi cation algorithm
, images taken in the fi eld were
analyzed visually and by the image analysis system. Between 400 (maize) and