Agriculture Reference
In-Depth Information
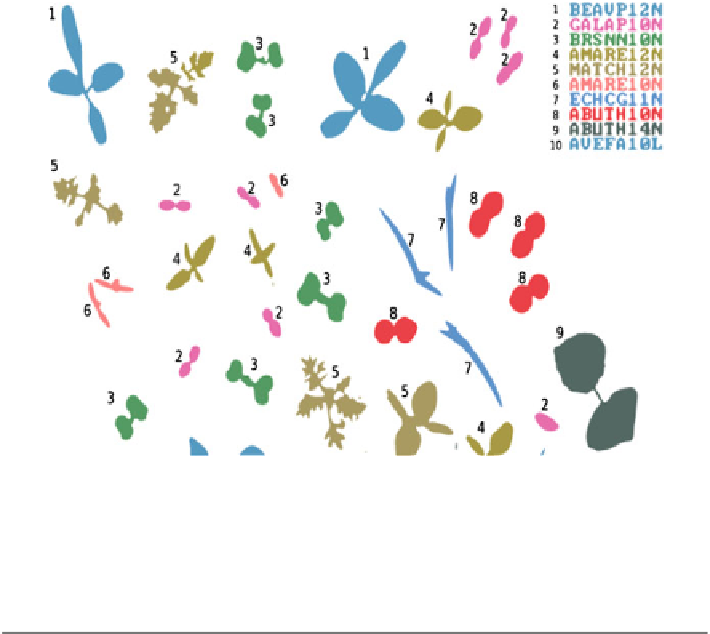
Fig. 10.8
Classifi cation examples: each classifi ed region denoted by a
color
and a
number
for the
class. The latter is defi ned by a so-called EPPO code (Weis et al.
2008
)
Table 10.1
Automatic classifi cation of plant species in maize (Zea mays) using digital image
analysis (data of 400 images) (Sökefeld et al.
2007
)
Identifi cation in % (identifi cation fi gures in horizontal lines add up
to 100 %)
Maize
(Zea mays)
Grass
weeds
Lambsquart.
(Ch. album)
Other
broadleafs
Sum
Maize
100
0
0
0
100
Grass weeds
0
90
4
6
100
Lambsquarters
10
0
90
0
100
Other broad-leaved species
0
1
1
98
100
Total
94
2,100 (winter wheat) images of unknown plants were taken for the testing. The
automatic classifi cation
resulted in an average of about 90 % correct identifi cation
when weed species and crops were grouped into 4-5 classes. The results of the
automatic classifi cation in maize and winter wheat are presented in Tables
10.1
and
10.2
. As must be expected, the identifi cation in % depended on the plant species that
were grouped together.
The classifi cation results of the images and the corresponding GPS data were used
for weed mapping and site-specifi c herbicide application. During the past 3 years, the
camera system was used for weed identifi cation in more than 100 ha of cereals,