Information Technology Reference
In-Depth Information
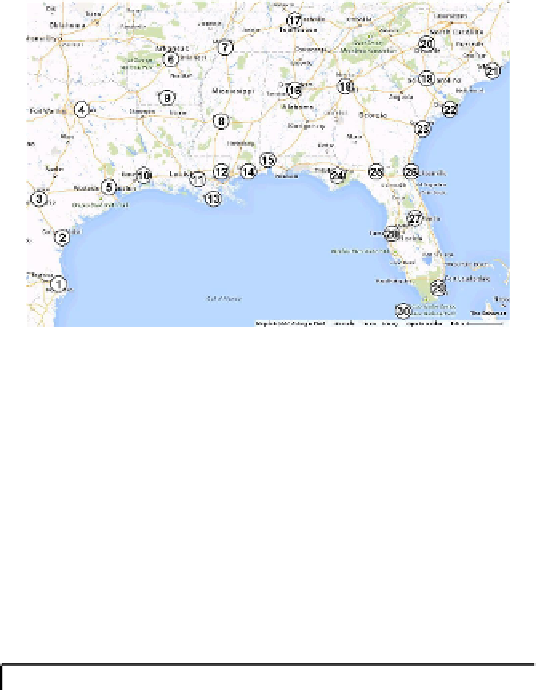
Fig. 2.
Cities in the case study - Southeast USA. (Map data: Google, INEGI)
close to capacity to reduce fixed costs. When the disaster damage is higher, it
is beneficial to establish more centres that are low cost (e.g., centre 23 for
D
=
3, and centres 4 and 23 for
D
= 6). When a large number of evacuation centres
are expected to be destroyed by the disaster (
D
= 9), the optimal solution relin-
quishes some high capacity (but high-cost) centres (e.g., centres 13 and 18) and
replaces them by more lower-cost centres. We also note that if the damage is
severe so that more evacuation centres are needed, the pre-positioned inventory
levels may not fully use the centres' capacities.
Tabl e 3.
Pre-positioned inventory level (thousand units)
Centres established
Size
h
i
D
=0
D
=3D=6
D
=9
2. Corpus Christi
Large 25 2105 2105 1875 1875
3. San Antonio
Large 20 2161 2161 2161 2161
4. Dallas
Medium 21 —
—
249 249
7. Memphis
Medium 26 —
—
— 1207
8. Jackson
Large 29 —
—
—
607
9. El Dorado
Large 27 2306 2306 2287 2034
13. New Orleans
Medium 30 725
725 725
—
18. Atlanta
Medium 38 1110 1110 1110 —
19. Columbia
Large 32 2289 2289 2289 1016
23. Savannah
Small 22 —
20
20
20
24. Tallahassee
Medium 29 —
—
— 1121
26. Jacksonville
Medium 28 —
—
— 1211
27. Orlando
Medium 30 1218 1198 1198 413
29. Miami
Small 27 25
25
25
25
— indicates that the centre is not established.
We summarize the insights for disaster relief planning from our computational
study as follows: