Biomedical Engineering Reference
In-Depth Information
Vasculature
Model
Pressure
Sensor
Syringe
Figure 4.12
Fluid closed loop for pressure variation and measurement
inside the blood vessel model.
The average green value of ROI
I
GP
for a pressure
P
is normalized
using
I
-
-
I
GP
GMin
I
(4.29)
GNP
I
I
GMax
GMin
I
GMin
and
I
GMax
are the minimum and maximum values of green,
respectively, and are obtained from
40
4
F
I
I
(4.30)
GMin
G
IG
200 20
F
(4.31)
where
F
IG
40
and
F
IG
200+
are the standard deviation of
I
G
40
and
I
G
200+
.
A sample of source images of photoelasticity and transmittance
measurements is shown in Fig. 4.13. We deduced from
I
G
40
that
I
GMin
is 23.32 and from
I
G
200+
that
I
GMax
is 53.86. For this experiment the
value of
M
G
=
510
nm and was obtained as described in previous
sections. The optical path length was calculated by applying equation
(4.6) to the transmittance images set.
I
I
GMax
G
IG
Variable
Thickness
Membrane
Phantom
Birefringence Higher near
the axis of the phantom
a)
b)
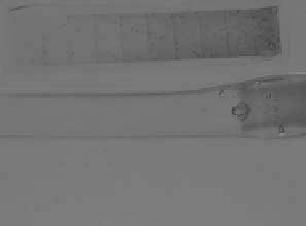
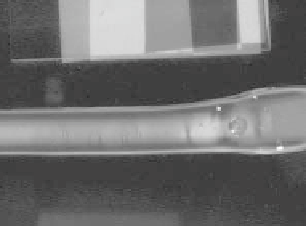
Figure 4.13
Source image example when
P
=
189
mmHg for: (a) optical
path length calculation (b) and retardation measurement.


Search WWH ::

Custom Search