Biomedical Engineering Reference
In-Depth Information
functional deficits (
Fig. 6.6-21
)
[41]
.Geneexpression
studies carried out with the help of imaging techniques
such as
in situ
hybridization suggest future needs for
correlating the information over a large number of
studies in different groups. In such spatial statistical
studies, each data point could be potentially repre-
sented as a multidimensional vector and presented to
the viewer using visualization techniques.
6.6.7 Parametric visualization
Parametric visualization addresses an emerging trend
arising from the analysis of images to characterize func-
tional information present in the images. Traditionally,
parameters that describe certain functional information
are computed and stored as numeric images that can be
displayed like any other image. However, it may require
large amount of storage space and processing time to
handle such numeric images because they are usually
represented as floating-point numbers and vector quan-
tities. To simplify the representation of such information,
parametric fields are used to provide an underlying
(usually smooth) model that can be evaluated at any
image location using its analytical formulation
[43]
.
One of the major advantages of a parametric field is
that it can efficiently make use of graphics architectures
to provide the visualization of the data, eliminating the
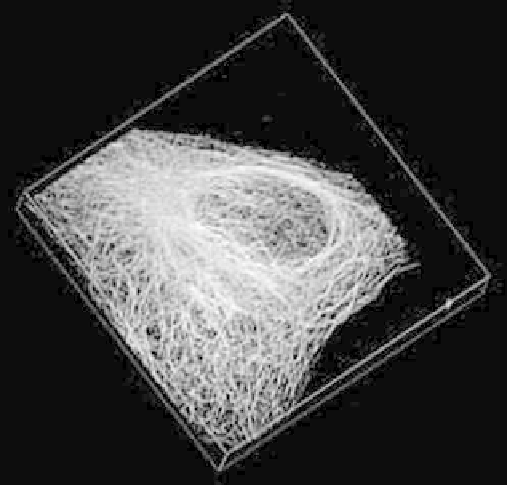
Figure 6.6-18 3D visualization of microtubules. Immunofluores-
cence labeling of U2OS (human osteosarcoma) cells with
monoclonal antibody to tubulin and a rhodamine-labeled secondary
antibody against mouse monoclonal antibody. The images were
acquired using a Noran confocal microscope. (Image courtesy of
Douglas Murphy, M. Solaiyappan.)
investigative research techniques in biology and medicine
are pursuing similar paths. Imaging methods in medicine
are increasingly becoming microscopic in scale, while
imaging in biology requires addressing the functional
properties of microscopic structures (
Figs. 6.6-17-
6.6-20
). These trends may lead to the development of
new types of visualization systems that try to combine
the scales. Image data in medicine are functionally rich,
while image datasets in biology are large because of the
very high optical resolution that can be achieved. One
emerging concept is virtual microscopy visualization,
where tiles of microscope images acquired from different
areas on a specimen are seamlessly stitched to form
a single large virtual image that can be zoomed and
panned as if it was acquired with a very large field of view
(
Fig. 6.6-17
). Combining these two types of data will
challenge the current visualization techniques in terms of
their current limitation in handling very large data sizes.
6.6.6 Visualization in spatial
biostatistics
Large collections of image databases in epidemiological
studies have been growing rapidly over the years, and
spatial statistical techniques are now being applied
to images of large populations. Applications include
relationships between such attributes as lesions and
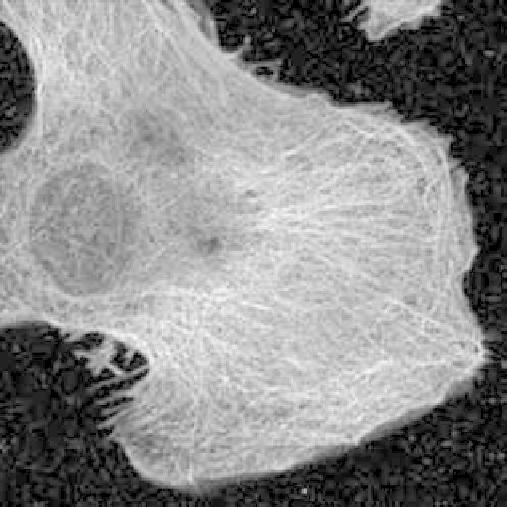
Figure 6.6-19 3D visualization of actin filaments. Reconstruction
of a mouse fibroblast with antibodies microtubules and actin
filaments, imaged using a Zeiss confocal microscope exciting in
the FITC and TRITC fluorescence spectra.