Biomedical Engineering Reference
In-Depth Information
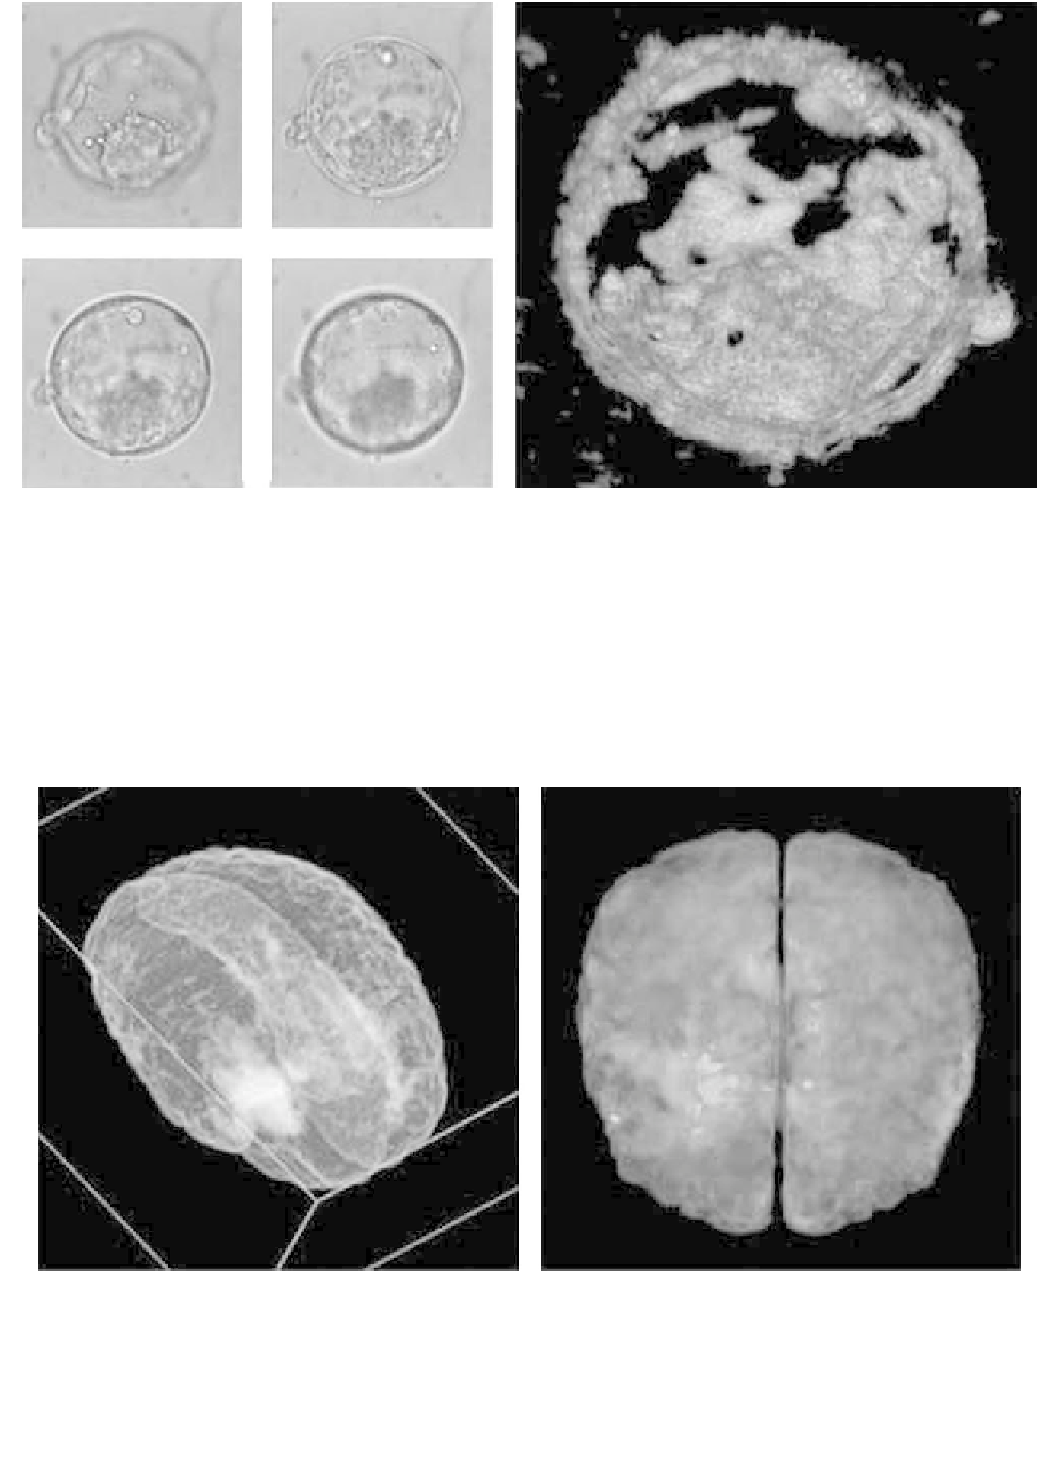
Figure 6.6-20 3D visualization of live human embryo, age 5 days (blastocyst). (Left) Four images from optical microscope at varying focal
plane. (Right) 3D volume by deconvolution showing the inner cell mass. (Images courtesy of M. Solaiyappan, Fong Chui Yee, Ariffeen
Bongso, Rakesh Mullick, Raghu Raghavan.)
precomputation time and the need for high-resolution
storage for visualization. Furthermore, successive de-
rivative parametric images, such as velocity or accelera-
tion maps from the motion fields, can be displayed in real
time.
The example presented here is a 4D B-spline based
motion field representation of cardiac-tagged MR images
(
Fig. 6.6-22
). A motion field with 7
7
7
15 control
points has been shown to adequately describe the full
motion of the heart during cardiac cycle. Using this field,
Figure 6.6-21 3D visualization of lesion-deficit associations. The development of ADHD (attention deficit hyperactivity disorder) was studied
using a voxel-based approach for a spatial statistical technique (Fisher's exact test) applied to a population of children involved in frontal lobe
injury. Higher intensity (left image) shows higher confidence of association in those regions. Right image shows the associated regions in
a color-mapped 3D Talairach atlas registered to the volume. (Images courtesy of V. Megalooikonomou, C. Davatzikos, E. H. Herskovits,
M. Solaiyappan.)