Geoscience Reference
In-Depth Information
Table 6.8 The input flows of radionuclides, heavy metals (suspended particles e and dissolved
fraction
w
) and oil hydrocarbons O to
Ω
by water
fl
flows taken into account in the SSMAE
Source
Flow into the
basin (km
3
/year)
Concentration of pollutant
137
Cs (Bq/l)
60
Co (Bq/l)
e (mg/l)
ʨ
(mg/l) O (mg/l)
Rivers
Yenisey
600
0.5
0.5
0.3
5.1
2.3
Ob
'
400
0.1
0.1
0.4
6.9
4.7
Lena
500
0.0
0.0
1.1
8.8
6.9
Pechora
130
0.1
0.1
0.3
1.5
3.0
Northern Dvina
100
0.0
0.0
0.2
1.1
4.0
Other Siberian
rivers
200
0.1
0.1
0.1
0.5
2.3
Rivers of North
America
600
0.2
0.2
0.1
1.0
1.0
Evaporation
3,500
0.0
0.0
0.0
0.0
0.0
Precipitation
5,300
0.0
0.0
0.1
0.1
0.0
Southern boundary of the
Norwegian Sea
12,000
0.1
0.1
0.6
2.2
2.4
Bering Strait
10,560
0.0
0.0
0.5
1.9
1.9
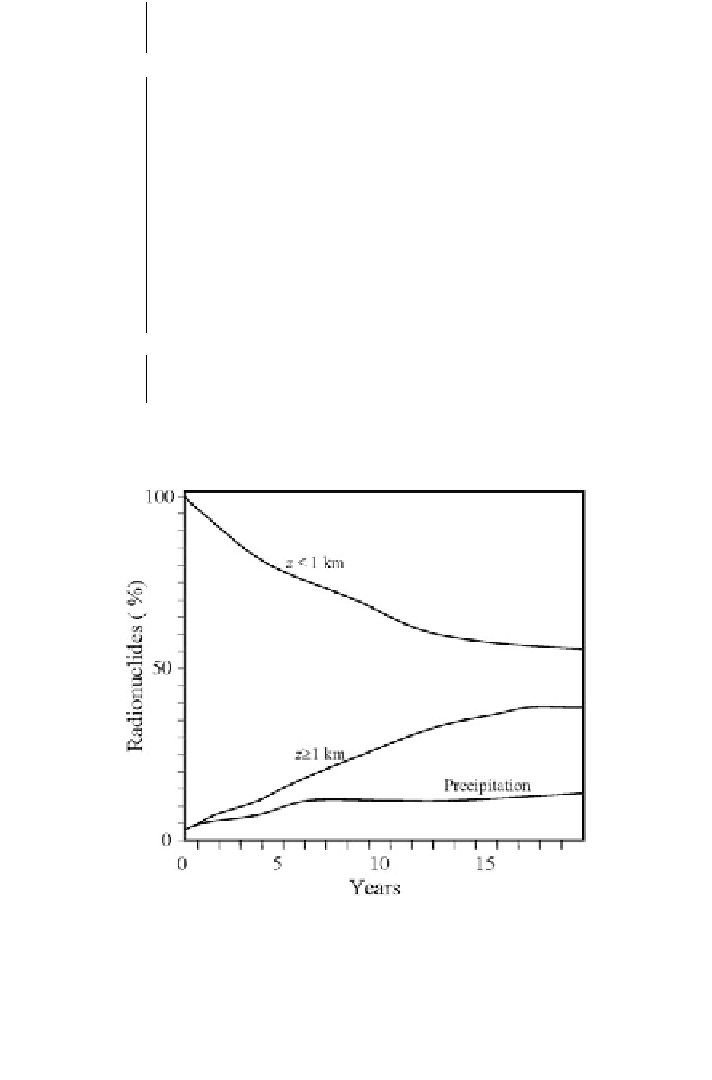
Fig. 6.8 Dynamics of the radionuclide distribution in the Arctic Basin. It is assumed that at the
moment t
0
= 0 radionuclear pollutants (
137
Cs,
60
Co; see Tables
6.4
and
6.7
) are in the upper water
layer z
≤
1 km only. The curves show the radionuclear pollutant distribution with time in the two
water layers and in the sediments obtained by the averaging of the simulation results for all of the
north seas


Search WWH ::

Custom Search