Geoscience Reference
In-Depth Information
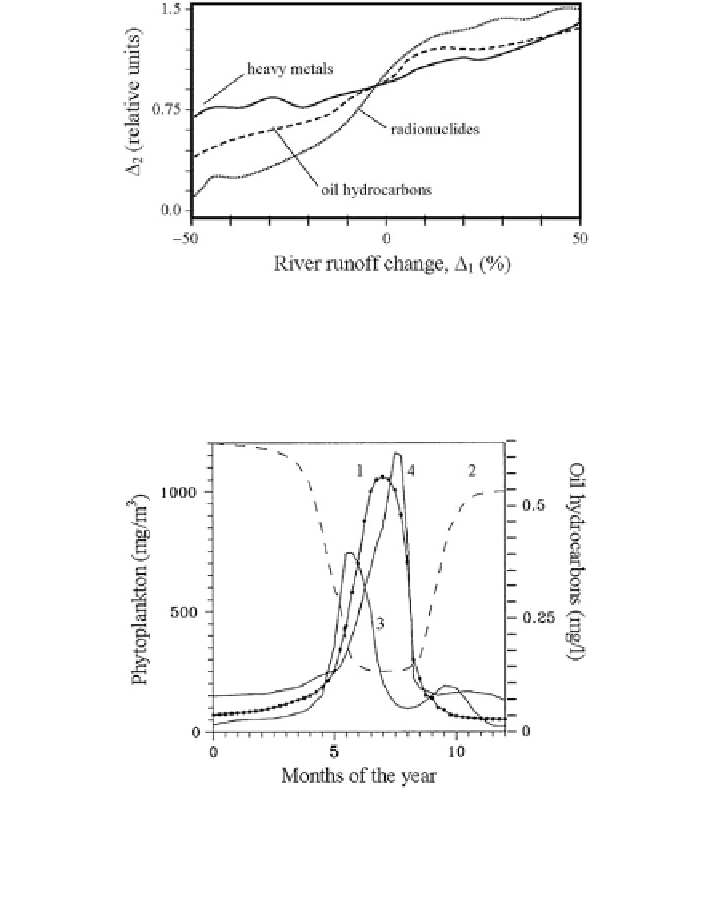
Fig. 6.9 In
fl
uence of variations in the river
fl
flows on the Arctic Basin pollution level. Here
ʔ
1
is
the percentage variation in the river
fl
ow to
Ω
with respect to the value averaged on
Ω
R
in the last
3 years and
ʔ
2
is the content of the pollutant averaged on all rivers in
Ω
R
and normalized to the
initial data (such that
ʔ
2
= 1 for
ʔ
1
=0)
Fig. 6.10 Influence of the Barents Sea ecosystem upon the dynamics of the oil hydrocarbons in
the sea water. The curves labeled 1 and 2 show the simulation results for the phytoplankton (solid
curve) and oil hydrocarbons (dashed curve), respectively. Curves 3 and 4 show the yearly
distribution of phytoplankton in the south-western and in the northern and north-eastern aquatories
of the Barents Sea, respectively, by Terziev (1992)
Local variations in the vertical distribution of radionuclides are determined by
both hydrological and ecological conditions. The correlation between these con-
ditions is a function of the season. Table
6.10
gives the estimates of the role of the
ecological processes in the formation of the vertical distribution of the radio nuclear
pollution of the arctic seas. These estimates show that the biological community
plays a minor role in the radionuclide transport from the upper layers to the deep
ocean.
Search WWH ::

Custom Search