Biomedical Engineering Reference
In-Depth Information
(b)
Before injection
After injection
(a)
Gd coating
Silica shell
Raman-active
layer
Gold core
Tumor-brain interface
MPR nanoparticle
Max
0
Presurgery
MRI
Postsurgery
Surgery
Photoacoustics
Max
Raman
Raman
0
Surgical planning
Deep tumor
localization
Fine margin
resection
Ex vivo
conrmation
of clean margins
1 week
Injection
day (0)
Max
0
figure 10.14
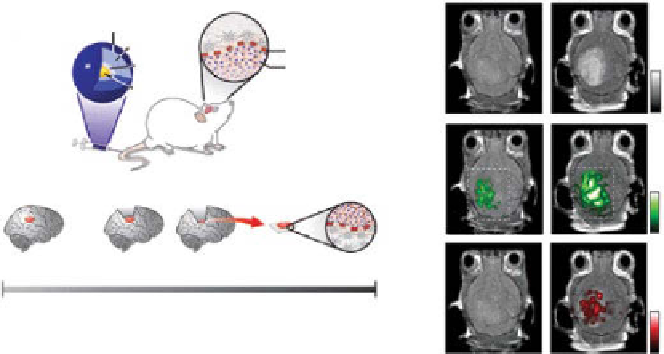
(a) Schematic and clinical scenario of brain tumor molecular imaging using
magnetic resonance imaging-photoacoustic imaging-raman imaging nanoparticle (MPr
nanoparticle). (b) Triple-modality identification of brain tumors in living mice with MPrs.
(reprinted with permission from ref. [149]. © Macmillan Publishers Ltd.)
All three images, acquired after injection of MPr nanoparticles, clearly visualize the
brain tumor through the intact skin and skulls of a living mouse (Fig. 10.14b). The
MrI contrast-to-noise ratio increased by approximately 536%, while the PA signal
increased by 75%. Further, the raman signal was 1.0 ± 0.09 AU after injection, while
the signal was not detectable before injection.
10.5.7
radiolabeled Photoacoustic contrast agent [150, 151]
Although PAT overcomes the shallow penetration depth of pure optical imaging by
probing several centimeters in tissues, the PA sensitivity decreases as the imaging
depth increases and the strong PA background signals from intrinsic contrasts reduce
the PA image contrast and sensitivity. This issue can be overcome by combining PAT
with another imaging tool that can provide high Snr in deep tissues and validate the
findings of each modality. When PAT combines with nuclear imaging, the strong
Snr and accurate quantification can be derived from nuclear imaging, whereas PAT
can provide improved local information with high spatial resolution. To study the
feasibility of the dual-modality imaging capability, radiolabeled optical absorbents
were developed for PAT and single-photon emission computed tomography (SPECT).
As the first approach, gold nanorods were radiolabeled with
125
I and conjugated with
antitumor necrosis factor (TnF-α) [151]. PA and nuclear imaging were performed to
identify the distribution of gold nanorods in articular tissues in small animals' tail
joints
in situ
. A microCT image clearly shows the sagittal section of the rat tail joints
in Figure 10.15a. The distribution of
125
I-gold nanorod-TnF-α conjugate and soft
tissue structures were clearly visualized by PAT, while the hard tissue structures
Search WWH ::

Custom Search