Chemistry Reference
In-Depth Information
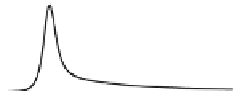
Fig. 7.8 (a)
e
2
spectrum and
photoconductivity spectrum
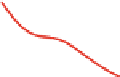
for Ni-Br-Br. (b)
jw
ð
3
Þ
ð
3
o;
o; o; oÞj
spectrum for
Ni-Br-Br (
dots
: experimental,
lines
: calculation) obtained
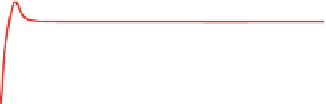
from THG experiments. (c)
jw
ð
3
Þ
ðo;
0
;
0
; oÞj
spectrum
for Ni-Br-Br obtained from
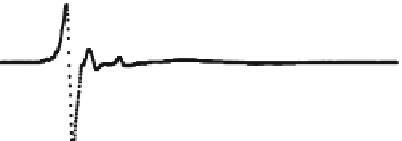
ER experiments. (d) Four-level
model. From [
11
]
Photon energy (eV)
1.2
1.5
1.8
2.1
40
a
d
Ni-Br-Br
RT
E
3
|3>
20
50K
μ
23
0
b
E
2
|2>
5
E
TH
TH
E
TH
TH
E
T
H
TH
μ
12
1
2
3
E
1
4
|1>
B
A
3
μ
01
μ
03
RT
2
C
0.6
0.7
1
B
|0>
0
0
0.4
0.5
0.6
0.7
F
undamental photon energy (eV)
3
c
X'
2
×
25
1
4K
0
-1
15
×
500
-2
10
-3
X
100
5
50
0
1.2
1.4
1.6
1.8
2
0
1.3
1.4
1.5
Photon energy (eV)
(~ 1.5 eV) than even-parity state |2
. The schematic of the energy level structure
consisting of the four states (four-level model) is shown in Fig.
7.8d
.
The nonlinear optical process associated with state |3
>
>
plays an important role
w
ð
3
Þ
ð
o; o; o; oÞ
jw
ð
3
Þ
ð
o; o; o; oÞj
on the overall |
spectra
calculated using the three-level model (blue line) and the four-level model (red line)
are shown in Fig.
7.8b
. In the three-level model, the transition process dominating
the optical response is
3
| spectrum. The
3
j
0
> !j
1
> !j
2
> !j
1
> !j
0
>
. In the four-level model,
the transition process related to |3
,is
added in the optical response. The three-level model does not reproduce well
structures C and B; the calculated |
>
, e.g.,
j
0
> !j
1
> !j
2
> !j
3
> !j
0
>
(3)
| values are smaller around structure C and
larger around structure B than the experimental |
w
(3)
|. On the other hand, the four-
level model reproduces the experimental result very well. This indicates that the
process related to state |3
w
>
reduces the optical nonlinearity around structure B. In


Search WWH ::

Custom Search