Chemistry Reference
In-Depth Information
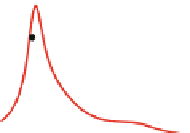
Fig. 7.9 (a)
e
2
and
photoconductivity spectra for
Ni-Cl-Cl and Ni-Cl-NO
3
.
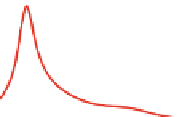
(b)
jw
ð
3
Þ
ð
3
o; o; o; oÞj
spectrum for Ni-Cl-Cl and
Ni-Cl-NO
3
.(
dots
:
experimental,
lines
:
calculation) obtained
from THG experiments.
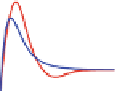
(c)
Fundamental photon energy (eV)
0.6
0.8
1
0.6
0.8
1
1.2
a
10
RT
RT
2
Ni-Cl-Cl
Ni-Cl-NO
3
5
1
50K
150K
0
0
b
TH
TH
2
TH
E
TH
1
TH
E
TTH
E
1
E
TH
TH
E
TH
TTH
E
2
2
; oÞj
spectrum for Ni-Cl-Cl and
Ni-Cl-NO
3
obtained from ER
experiments. From [
11
]
jw
ð
3
Þ
ðo;
0
;
0
×
2.5
1
RT
RT
0
c
4
×
0
0.4
2
0.2
-4
1
0
0
-8
1.9
2
2.1
2
2.1
2.2
77K
77K
1.8
2.4
3
1.8
2.4
3
3.6
Photon energy (eV)
w
ð
3
Þ
originating from the process
other words, in the process related to structure C,
j
0
> !j
1
> !j
2
> !j
3
> !j
0
>
partially cancels the process
j
0
> !j
1
> !j
2
jw
ð
3
Þ
ð
> !j
1
> !j
0
>
. Thus, state |3
>
affects the spectral shape of
3
o; o; o; oÞj
in the region not only of the three-photon resonance to |3
>
but also of the two-
photon resonance to |2
>
.
w
ð
3
Þ
ðo;
spectrum at 4 K (Fig.
7.8c
) obtained by the ER
measurement gives more detailed information about state |3
The Im
0
;
0
; oÞ
>
in Ni-Br-Br [
11
].
At around 1.4 eV, a new structure labeled as X
0
appeared, which had a plus-minus
structure. Such a plus-minus structure can be explained not by the presence of a
single discrete level but by the presence of continuum states. When continuum
states exist, the zero-crossing energy in the Im
w
ð
3
Þ
spectrum corresponds to the
lower edge of the continuum (the band-edge), which is 1.41 eV in Ni-Br-Br.
This four-level picture was also confirmed from the results in Ni-Cl-Cl and
Ni-Cl-NO
3
, which are shown in Fig.
7.9
.
jw
ð
3
Þ
ð
w
ð
3
Þ
ðo;
3
o; o; o; oÞj
and Im
0
;
0
spectra of Ni-Cl-Cl and Ni-Cl-NO
3
are shown in Fig.
7.9b, c
, respectively.
jw
ð
3
Þ
ð
; oÞ
o; o; o; oÞj
spectra were reproduced well by the four-level model as
shown by red solid line in Fig.
7.9b
.Im
3
w
ð
3
Þ
ðo;
;
; oÞ
spectra were compared
with the results of the three-level and the four-level calculations as shown by blue
and red lines, respectively, in Fig
7.9c
. The four-level model can reproduce the
experimental results better. Particularly, the negative components at ~2.0 eV in
0
0


Search WWH ::

Custom Search