Biomedical Engineering Reference
In-Depth Information
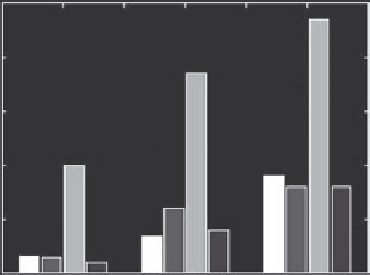
A
0.07
2930
0.06
2880
2851
1662
III
0.05
0.04
II
0.03
0.02
I
0.01
0.00
Grades
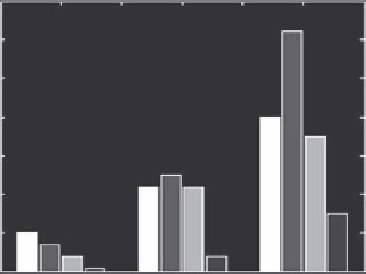
B
0.05
1442
1260
1096
992
0.04
III
0.03
II
0.02
I
0.01
0.00
Grades
Figure 5.6
Plots of the amplitudes of selected peaks, from the Raman difference spectra presented as a
function of the IDC grade of the breast tissues.
carbonyl stretching modes of nucleic acids [34] and C=C stretch of lipids [35],
confirm the changes in the chemical structure of the breast tissue and this
change in intensity provides useful information in differentiating among the
IDC grades.
Raman Differences among DCIS Grades (LNG, ING, and HNG)
Raman spectra from LNG, ING, and HNG DCIS tissues normalised with
respect to maximum absorption intensity are shown in Figures 5.7 and 5.8.
There are significant spectroscopic differences observed between the three
DCIS grades in both the relative and absolute intensities of absorption bands
in the spectra. The absolute intensity of each of the OH-NH-CH peaks, in the
3500-2700 cm
−1
region [31], increases with increasing grade (low/intermedi-
ate/high), indicating an increase in concentrations of fatty acyl chains (32),
phospholipids, cholesterol, and creatine [25], proteins [32,33] and nucleic


Search WWH ::

Custom Search