Biomedical Engineering Reference
In-Depth Information
and proteins [23,27]; and amide III and CH
2
wagging vibrations from glycine
backbone and proline sidechains, as well as asymmetric PO
2
−
(phosphate I)
[27-31] vibrations, respectively. The presence of amide I bands further con-
firms the increase in protein content in the cancer tissue as compared to the
normal tissue.
Raman Differences among IDC Grades (I, II, and III)
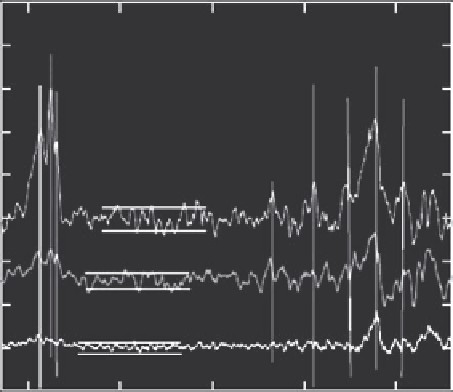
Figures 5.5 and 5.6 illustrate the differences among grades I, II, and III of
IDC. The Raman spectrum of the normal tissue is weaker in intensity than
that of the IDC tissue and the intensity of the peaks increases with increas-
ing grades; grade III has the highest intensity, grade I possesses the mini-
mum, and grade II lies in between (Figure 5.7). The increase in intensity of
the OH-NH-CH peaks suggests a change in the lipids, proteins, and DNA
contents. The absolute intensity of each of the OH-NH-CH peaks in the
3500-2700 cm
−1
region [31] varies with increasing grade (I, II, and III), indi-
cating varying concentrations of fatty acyl chains [32], phospholipids, choles-
terol, and creatine [25], proteins [32,33] and nucleic acids [21,25].
Similarly, an increase in intensity and shifting of peaks in the area of 1660-
600 cm
−1
, peaks of nucleic acids due to the base carbonyl stretching and ring
breathing mode [34], and amide absorption having some overlap with the
0.16
2880
0.14
1096
1442
1260
2930
2851
0.12
992
0.10
1662
0.08
0.06
0.04
0.02
0.00
-0.02
3000
2500
2000
Wavenumber/cm
-1
1500
1000
Figure 5.5 (See colour insert.)
Raman difference spectra among various grades of IDC and control tissues. Grade I minus
control, Grade II minus control, and Grade III minus control are in black, red, and blue, respec-
tively. Horizontal double lines indicate the level of noise in order to facilitate justification of
peak significance.
Search WWH ::

Custom Search