Biomedical Engineering Reference
In-Depth Information
0.25
2880
2851
0.20
1442
0.15
1662
780
1260
1955
992
0.10
0.05
0.00
3000
2500
2000
Wavenumber/cm
-1
1500
1000
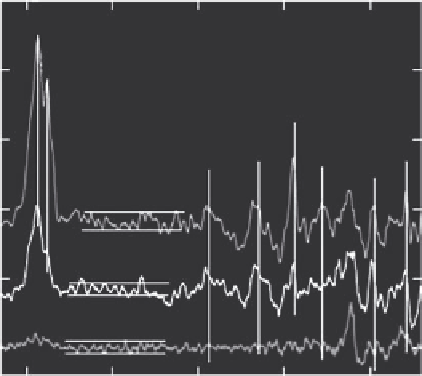
Figure 5.7 (See colour insert.)
Raman difference spectra among various grades of DCIS and control tissues. LNG grade
minus control, ING grade minus control, and HNG grade minus control are in red, black and
blue, respectively. Horizontal double lines indicate the level of noise in order to facilitate justi-
fication of peak significance.
acids [21,25]. In addition, the intensity of the absorption bands at 2958 cm
−1
(asymmetric CH
3
of lipids, DNA, and proteins) [36], 2920 cm
−1
(asymmetric
CH
2
of lipids) [31,36,37] and 2851 cm
−1
(symmetric CH
2
of lipids) [31,36,37]
is highest in HNG, progressing to the lowest relative intensity in LNG.
This indicates that the tissue section giving rise to the spectrum from HNG
is lipid- and acylglyceride-rich and the one giving rise to the spectrum from
LNG is protein-rich, while the one giving rise to the ING spectrum contains
significant amounts of both lipids/acylglycerides and proteins. This comple-
ments the FTIR data reported in the previous section.
Similarly, the variation in intensity of the peaks in the spectral region 1660-
700 cm
−1
(phosphodiester stretching bands region, for absorbances due to
collagen and glycogen [38] and porphyrin ring of heme proteins [39]) also con-
firms that the HNG spectrum is rich in acylglyceride and the LNG spectrum
is rich in protein contents. The amide I band centred at 1660 cm
−1
(arising from
C=O and C=C stretching vibrations) [25,26,40] not only varies in intensity,
but also in shape, since HNG has a higher intensity as compared to ING and
LNG, confirming the varying protein contents with respect to the grades.
FTir Spectroscopy of breast Tissue Samples
In this study, FTIR microspectroscopy was conducted using an ATR slide
on an objective equipped with diamond crystal (Spectra-Tech™, USA) on
Search WWH ::

Custom Search