Graphics Reference
In-Depth Information
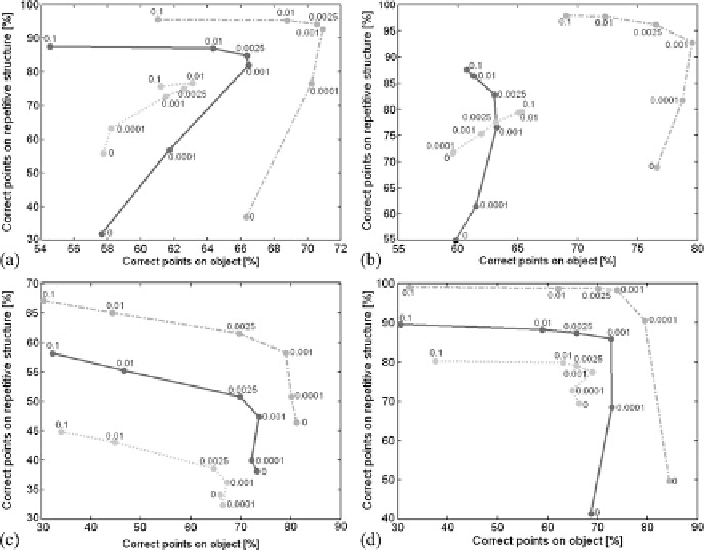
Fig. 1.29
Three-dimensional reconstruction results for the three examined scenes. The
solid curve
is obtained by evaluating the correspondence matrix
E
t
defined in (
1.136
) with the uniqueness
constraint, the
dashed curve
by applying the combined uniqueness and ordering constraint, and the
dotted curve
by applying the minimum weighted matching constraint. The numbers on the curves
denote the corresponding values of the weight parameter
λ
e
.(
a
) Scene 1 (fence with person).
(
b
) Scene 2 (keyboard with hand). (
c
) Scene 3 (arm with bar). (
d
) Scene 4 (building with person)
dimensional points correctly assigned to the scene part displaying repetitive struc-
tures versus the fraction
F
obj
of three-dimensional points correctly assigned to the
object in front of it, varying the value of the weight parameter
λ
e
defined in (
1.136
).
See Fig.
1.29
. Each three-dimensional point is evaluated with respect to its associa-
tion with the area showing repetitive structures or the object in front of it, where the
maximum allowed disparity deviation from the correct value amounts to
±
5pixels
for the outdoor scenes and
10 pixels for the indoor scenes.
For all four examined example scenes, the evaluation of the correspondence ma-
trix
E
t
defined in (
1.136
) based on the combined uniqueness and ordering constraint
always yields the highest fraction of correct points in the image area with repetitive
structures and correct points on the object (cf. Table
1.3
). Setting
λ
e
=
±
0 is equiva-
lent to neglecting the model information. Increasing
λ
e
to a value of 0
.
001 strongly
increases the value of
F
rep
, while the fraction
F
obj
remains largely constant. If
λ
e
is
increased further,
F
rep
only slightly increases further while
F
obj
decreases strongly.
As a consequence, the intuitively best result is obtained by setting
λ
e
to values
Search WWH ::

Custom Search