Biomedical Engineering Reference
In-Depth Information
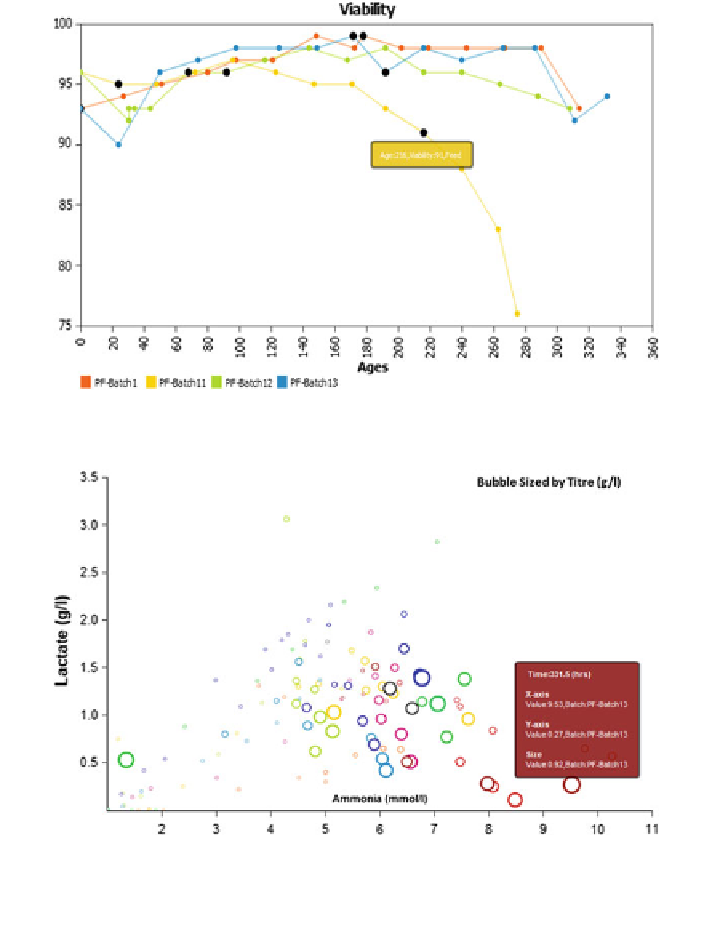
Fig. 8
Chart comparing the profile of the same parameter for different batches
Fig. 9 Scatter plot for three time-series parameters: lactate concentration, ammonia concentra-
tion and titre values, represented by the Y-axis, X-axis, and bubble size, respectively. For each
batch, there are a series of values for all three parameters according to culture age. Different
batches are represented in different colours
decreases. This is indicative of lactate consumption by the cells. The ammonia
concentration, however, continues to increase in the culture broth with time.
A parallel coordinates chart is a useful way of presenting data that involve
multiple parameters and where the aim is to study the effect of those parameters on
the final process output (e.g. yield, recovery etc.). In this chart, each parameter is
represented on the horizontal axis and a vertical reference line is drawn for each
Search WWH ::

Custom Search