Biomedical Engineering Reference
In-Depth Information
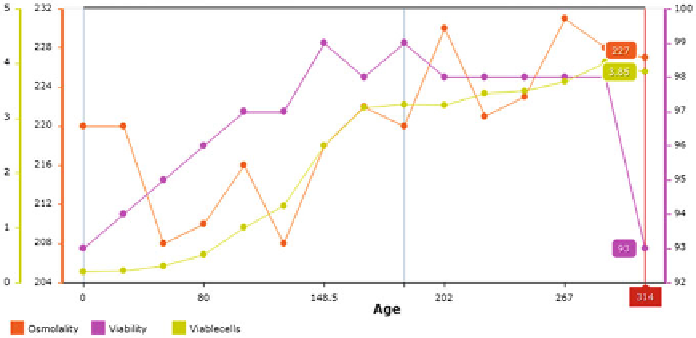
Fig. 7
Profiles of three parameters for a single batch of a cell culture process
• To monitor multiple time-series parameters belonging to the same unit operation
for a single batch in one view, parameters of interest can be displayed on
multiple Y-axes, one for each parameter, whereas the X-axis can show the
process time. This gives a complete picture of the parameter profiles for one
batch (Fig.
7
).
• Another way of visualizing this kind of data is to compare profiles for a single
parameter for different batches in one view. The X-axis again shows the process
time, while the Y-axis shows the parameter of interest and the various graphs on
the chart correspond to different batches (Fig.
8
).
A bubble chart is a variation of a scatter plot where the markers of the scatter
plot are replaced by bubbles and a third dimension of ''bubble size'' is plotted
along with the two dimensions (X and Y) of the scatter plot. It can therefore be
used to study three parameters at a time, each represented by one dimension
(X-axis, Y-axis and bubble size). Such a chart provides a visual representation of
the relationship that exists among three parameters and how the change in one
affects the other two. Also, by plotting the values of three parameters for different
batches, it conveys useful information about the region where most of the values
lie for the three parameters for the majority of the batches and may help in easily
detecting outliers; For example, the chart in Fig.
9
shows time-series data for three
cell culture parameters: lactate concentration, ammonia concentration and product
titre. Data from 15 historical batches are plotted on the chart, each represented by a
different marker colour. Two patterns quickly emerge from this chart:
• At lower titres (small bubble size) both lactate and ammonia concentrations in
the culture broth are increasing. This indicates the early phase of the cell culture
process.
• The end of the cell culture process is indicated by higher titres (larger bubble
size). It can be seen that, in this portion of the process, the lactate concentration
Search WWH ::

Custom Search