Biomedical Engineering Reference
In-Depth Information
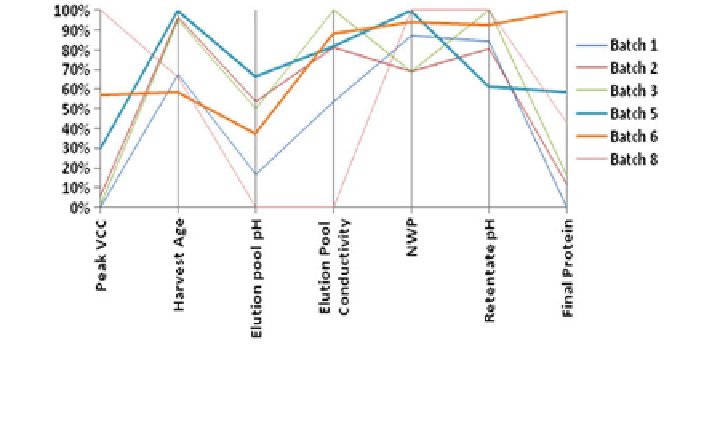
Fig. 10 Parallel coordinates chart of various parameters for different batches on a scale of
0-100 %, where 0 % denotes the minimum value and 100 % denotes the maximum historical
value of each parameter
parameter to indicate its scale. One batch is taken at a time, and all the parameters
of interest are plotted for that batch on the vertical axis. All the points for that
batch on these vertical reference lines are then connected with a line. Multiple
batches can be similarly plotted on the chart, with each line representing one batch.
In this way, each line represents the profile of one batch and can be compared with
the profiles of other batches. Thus, this allows comparison of different batches
across various dimensions (parameters), which helps to detect patterns, correla-
tions or exceptional profiles.
Figure
10
shows a parallel coordinate chart for multiple parameters relating to
different stages of the process. As the parameter scales are different, the scales have
been normalized, with 0 % representing the minimum value of a parameter and
100 % representing its maximum value for a given dataset. The highlighted lines
represent the batches with exceptional profiles (batch 5 and batch 6 in this example).
A treemap is used mainly to visualize large datasets. It provides a useful means
of displaying data with hierarchical structure. It represents the hierarchy in the
dataset by forming a hierarchical structure of rectangles inside rectangles. The
rectangles at the lowest level mainly represent the metrics that need to be tracked.
The size and colour of the rectangles can be used to represent various dimensions
of data.
Figure
11
shows a representation of the step recovery for various batches
belonging to different unit operations of the process. The first level of the hierarchy
consists of four rectangles, each representing a different unit operation. The second
level of the hierarchy consists of 14 rectangles inside each unit operation, repre-
senting the executed batches of that particular unit operation. The colour of these
rectangles represents the parameter '' % step recovery'' for that batch and unit
operation. This can provide a useful visualization to quickly answer questions such
as:
Search WWH ::

Custom Search