Database Reference
In-Depth Information
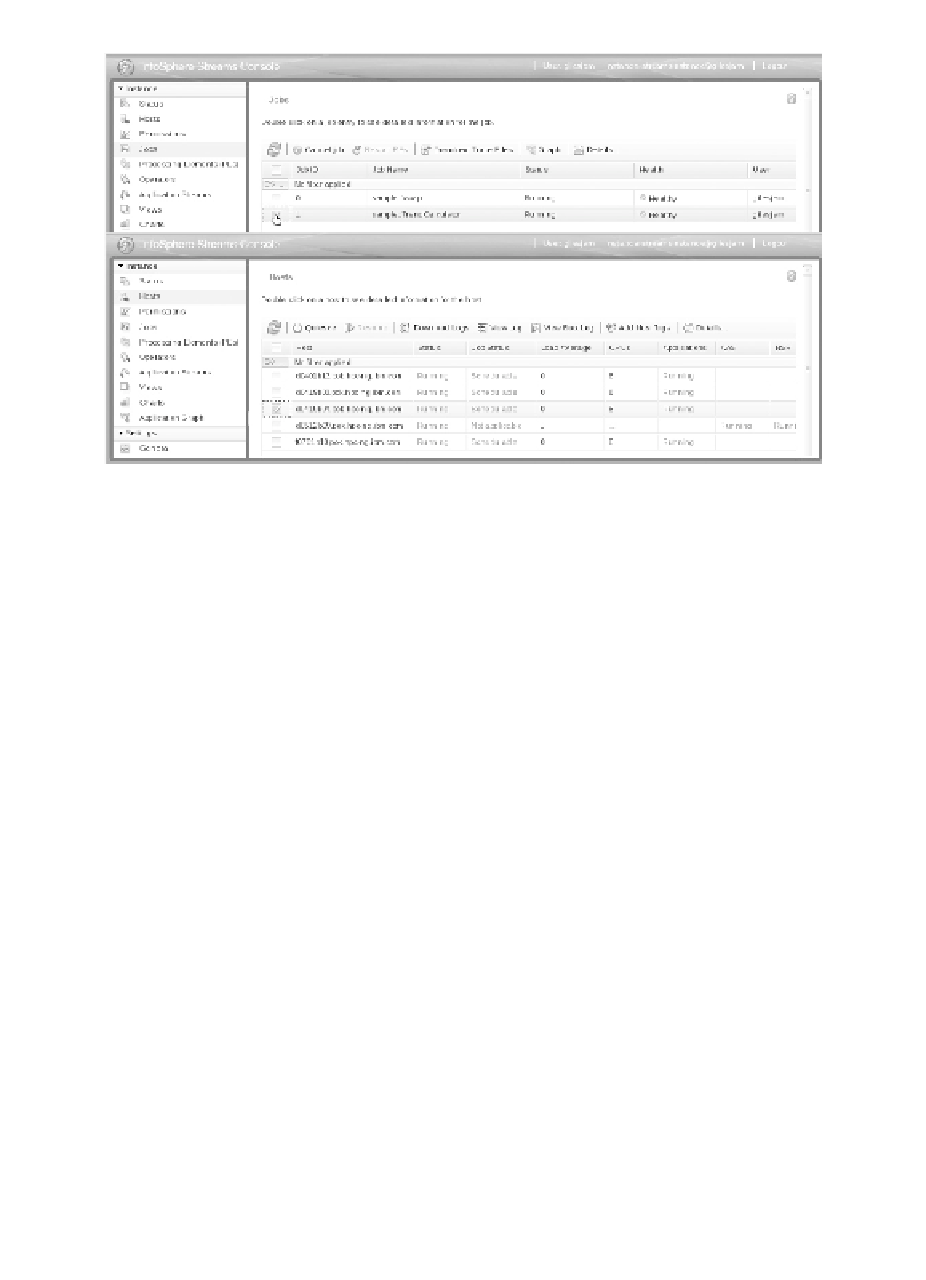
Figure 6-3
The management of jobs and hosts in the Streams Console
Operations Visualized
A great new feature in the Streams Console is the ability to monitor results of
Streams applications in a very natural way, using graphs. The Application
Graph feature displays all running applications and run-time metrics from a
Streams instance in an interactive and customizable window.
For example, Figure 6-4 illustrates two running financial services applica-
tions, one calculating trend metrics and one calculating the volume-weighted
average price (VWAP) for every stock symbol on a tick-by-tick basis. At the
top of Figure 6-4, you can see that the graph is configured to continuously
update the color of the operator based on the tuple rate. The thickness of the
lines is also updated to be proportional to the data flow rate to give you a
quick idea of how much data is flowing. The bottom of Figure 6-4 illustrates
a different view, in which the operators are grouped by job. By clicking on an
operator in the TrendCalculator application, additional information, such as
tuples processed by the operator, is displayed. Clicking on other objects, such
as ports or a stream, also provides significant detail. These graphs are similar
to Streams Live Graph in previous versions of Streams, but they are now also
exposed through the Streams Console, making them easier for administrators
to access.