Biomedical Engineering Reference
In-Depth Information
(A)
(B)
(C)
(D)
150
Cell A
Cell B
Cell C
100
50
0
-50
-100
-150
3
2
1
2
0
0
-1
-2
-2
-3
y
(microns)
x
(microns)
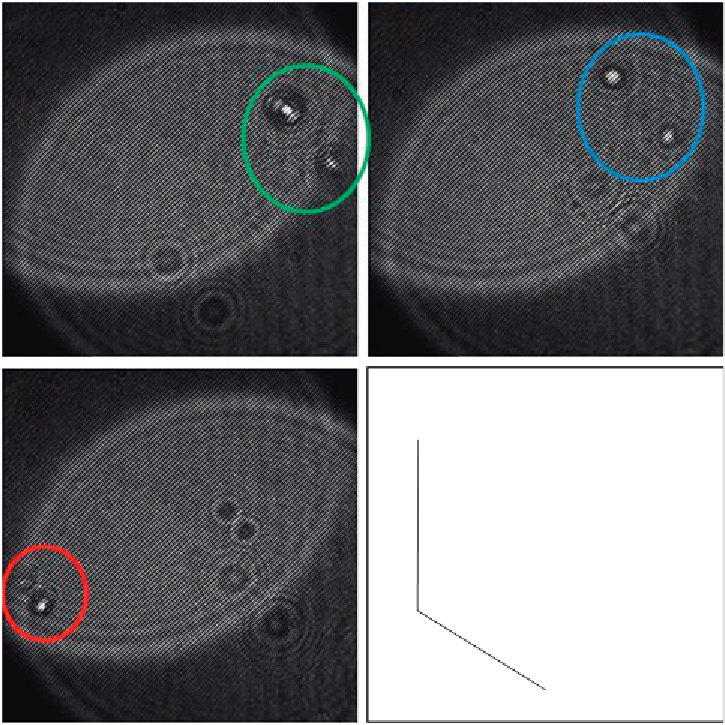
Figure 10.12
(AC) Three frames corresponding to the passage of three different mouse cells across the
imaged volume. (D) The estimated paths for random motion of the three cells.
experimental configuration in
Figure 10.1
, a sequence of images by the CCD array; some of
these frames are shown in
Figure 10.12A
C
. Also in this case, we estimated cell centroids
by an image processing algorithm for each frame of the recorded sequences.
The results of the retrieved 3D paths of the cells were simply estimated by the proposed
method. The 3D plot of the paths are shown in
Figure 10.12D
. From the last result, it is
clear that all three cells follow paths along the same streamlines in the microfluidic flux.
Cells experience a displacement mainly along the longitudinal axis. This is due to the twin
beams exerting on them the driving effect described before. Nevertheless, the optical
configuration can be designed to cancel the effect of the light on the paths. In fact, by using


Search WWH ::

Custom Search