Graphics Reference
In-Depth Information
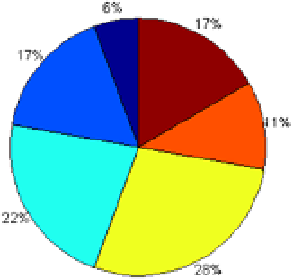
Figure 2-18.
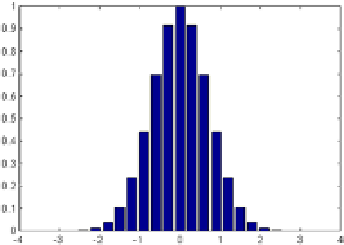
Below, is a bar chart for 20 values of a normal between - 3 and 3:
>> x = -3:0.3:3;
>> bar(x, exp(-x.^2))
This generates the graph in Figure
2-19
.
Figure 2-19.
Figure
2-20
represents the step graph corresponding to the previous bar graph whose syntax is:
>> x = -3:0.3:3;
>> stairs(x,exp(-x.^2))
Figure 2-20.