Graphics Reference
In-Depth Information
2.8 Bars and Sectors Graphics. Histograms
MATLAB constructs bar graphs, sectors, Pareto diagrams and histograms of frequencies through the following
commands:
bar(Y)
draws a bar graph relative to the vector of magnitudes
Y.
bar(X,Y)
draws a bar graph on the vector of magnitudes
Y
whose elements are given by the
vector
X
.
stairs (Y)
draws the staggered step graph relative to the vector
Y.
stairs(X,Y)
draws the ladder graph relative to the vector
Y
whose elements are given by the
vector
X
.
hist(Y)
draws a histogram using 10 vertical rectangles of equal base relative to the Y vector
frequencies.
hist(Y,n)
draws a histogram using vertical rectangles of equal base relative to the Y vector
frequencies.
hist(Y,X)
draws a histogram, using vertical rectangles whose bin center values are specified
in the elements of the vector
X,
relative to the
Y
vector frequencies.
foot(X)
draws the pie chart relative to the
X
vector frequencies.
pie(X,Y)
draws the pie chart relative to the
X
vector frequency leaving out the sectors in
which Yi<0.
pareto(X)
draws the Pareto graph relative to the vector
X.
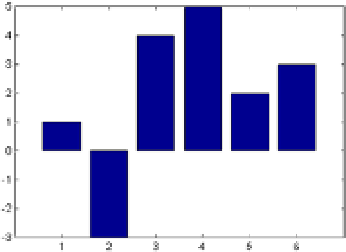
Here are some examples:
>> bar([1 - 3, 4, 5, 2, 3])
>> pie([1, 3, 4, 5, 2, 3])
The graphics are in Figures
2-17
and
2-18
.
Figure 2-17.