Agriculture Reference
In-Depth Information
*
*1A
0.12
0.11
0.10
0.09
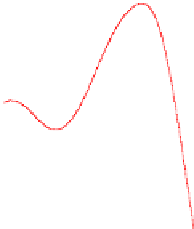
Carbonyl ester (C=O)
stretching vibration
band baseline ca.
1771-1714 cm
-1
0.08
0.07
0.06
0.05
0.04
0.03
0.02
0.01
0.00
4000
3500
3000
2500
2000
1500
1000
Wavenumbers (cm-1)
(a)
Typical spectral bands that mainly associate with lipid in peas.
0.090
0.085
0.080
0.075
0.070
0.065
0.060
0.055
Carbonyl ester (C=O)
stretching vibration band
was ca. 1745 cm
-1
; baseline
ca. 1771-1714 cm
-1
bands
0.050
0.045
0.040
0.035
0.030
0.025
0.020
0.015
0.010
0.005
0.000
1780
1760
1740
1720
1700
1680
Wavenumbers (cm-1)
(b) Carbonyl ester (C=O) stretching vibration band ca. 1745 cm
-1
; baseline ca. 1767-
1710 cm.
1
Figure 2. Typical FTIR-ATR spectrum in CDC peas in the mid-IR region ca. 4000-800
cm-1 (a) showing function groups that mainly associated with lipid: (b). carbonyl ester
(C=O) stretching vibration band was ca. 1745 cm-1; baseline ca. 1771-1714 cm-1.