Agriculture Reference
In-Depth Information
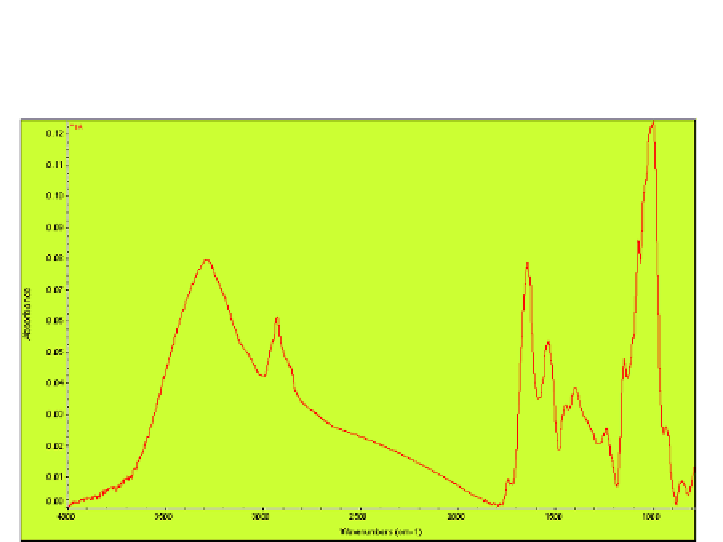
group band in a typical spectrum in the green-type and yellow-type of CDC
peas (
Pisum sativum
) normally located in the region of ca. 1771-1714 cm
-1
(Figure 2a) and 3001 - 2799 cm
-1
, respectively.
Figure 1. Typical spectrum in green-type (CDC Strike) of peas: 4000-800 cm-1.
The component peaks and frequencies that comprise the antisymmetric
and symmetric CH
2
and CH
3
stretching bands in the CH region were identified
using the second derivative function. The spectral intensities of peak height
and area of the component bands representing antisymmetric CH
2
and CH
3
stretching functional group bands and their ratios in the original spectra were
calculated (Figures 2b). Statistical analyses of spectral intensity of height, area
and ratios of different molecular functional groups (antisymmetric CH
3
and
antisymmetric CH
2
functional groups, symmetric CH
3
and symmetric CH
2
functional groups, as well as carbonyl C=O ester group) were performed using
the MIXED procedure of SAS (version 9.1.3). The contrast statement was
used to compare between the raw and the heated seed samples. For all
statistical analyses, significance was declared at
P
< 0.05. Differences among
the treatments were evaluated using a multiple comparison test following the
Tukey method.