Image Processing Reference
In-Depth Information
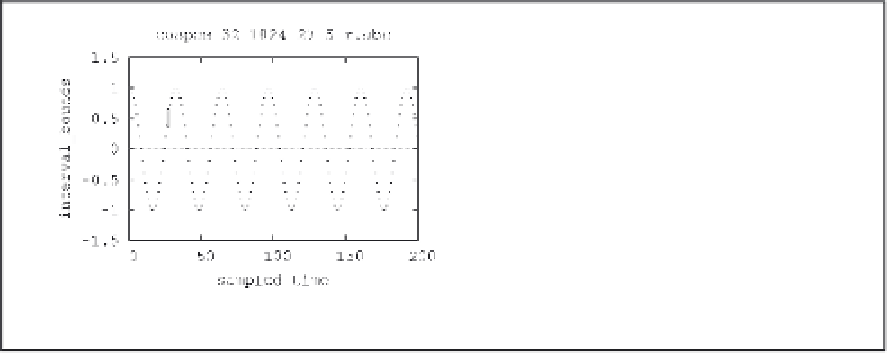
Figure 4.a shows a cosine signal of length 1024 and period 32, in which only an interval of
width 1/5 in the sample 27 has been included, and Figure 4.b shows the computed FFT of
the previous interval trace. In this case, two small intervals appear in the sampled
frequencies 32 and 968, as well as in the values near 0 in the other frequencies. Unlike the
results shown in Figure 3, the uncertainties associated with the input interval are very small
in this case.
(a) (b)
Fig. 4. Example of an FFT of a deterministic signal with a single interval: (a) First 200
samples of a cosine signal of length 1024, period 32 and interval width 1/5 in the sample 27.
(b) FFT of the previous signal, with two small uncertainties in the sampled frequencies 32
and 968.
Figure 5 shows the details of the ripples generated by the uncertainties according to their
positions in each trace. In the first case (Figure 5.a), the interval has been included in sample
16, which is a factor of the number of FFT points. In this case, there is no ripple. In the other
three cases (Figures 5.b-d), the interval has been included in three different positions (17, 20
and 27, respectively), and there is a small ripple in the transformed domain, different in each
case. Since the FFTs are linear systems, the large ripples that appear in the Figures 3.b and
3.d are the sum of all the possible equal-width ripples in the frequency domain.
In summary, the inclusion of intervals in sinusoidal signals and the computation of the FFTs
show the maximum and minimum deviations in the frequency domain due to the different
uncertainties. It has been found that the uncertainties do not affect to all the frequencies of
the FFT in the same way, and that their effects depend on their positions in the trace.
Although the intervals represent the maximum values of the uncertainties and the noise is
commonly associated to the second-order statistics, the variations in the computed interval
widths implies that the noise generated by the FFT is not white, but follows a deterministic
pattern.
3.3 Analysis of the statistical parameters of random signals using interval-based
simulations
The following experiments show the variations of the statistical parameters of random
signals (mean, variance and PDF) when random sequences are generated using the Monte-
Carlo method, using intervals of a specified width instead of the traditional numerical
simulations.