Environmental Engineering Reference
In-Depth Information
18,000
0.90
18,000
0.90
NBI-B-Low
In-B-Low
16,000
0.80
16,000
0.80
14,000
0.70
14,000
0.70
Vavg
Flat
Up
Down
Hill
Valley
Vavg
Flat
Up
Down
Hill
Valley
12,000
0.60
12,000
0.60
10,000
0.50
10,000
0.50
8,000
0.40
8,000
0.40
6,000
0.30
6,000
0.30
4,000
0.20
4,000
0.20
2,000
0.10
2,000
0.10
-
0.00
-
0.00
1
3
5
7
9
11
13
15
17
19
21
1
3
5
7
9
11
13
15
17
19
21
Figure 8.19
Average volume (m
3
) and reliability for 21 scenario of network B at low altitude range
18,000
0.90
18,000
0.90
NBI-B-Medium
In-B-Medium
16,000
0.80
16,000
0.80
14,000
0.70
14,000
0.70
Vavg
Flat
Up
Down
Hill
Valley
Vavg
Flat
Up
Down
Hill
Valley
12,000
0.60
12,000
0.60
10,000
0.50
10,000
0.50
8,000
0.40
8,000
0.40
6,000
0.30
6,000
0.30
4,000
0.20
4,000
0.20
2,000
0.10
2,000
0.10
-
0.00
-
0.00
1
3
5
7
9
11
13
15
17
19
21
1
3
5
7
9
11
13
15
17
19
21
Figure 8.20
Average volume (m
3
) and reliability for 21 scenario of network B at medium altitude range
18,000
0.90
18,000
0.90
NBI-B-High
In-B-High
16,000
0.80
16,000
0.80
14,000
0.70
14,000
0.70
Vavg
Flat
Up
Down
Hill
Valley
Vavg
Flat
Up
Down
Hill
Valley
12,000
0.60
12,000
0.60
10,000
0.50
10,000
0.50
8,000
0.40
8,000
0.40
6,000
0.30
6,000
0.30
4,000
0.20
4,000
0.20
2,000
0.10
2,000
0.10
-
0.00
-
0.00
1
3
5
7
9
11
13
15
17
19
21
1
3
5
7
9
11
13
15
17
19
21
Figure 8.21
Average volume (m
3
) and reliability for 21 scenario of network B at high altitude range
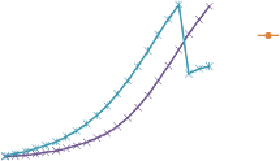
The results of the same analysis for network
B
are shown in Figures 8.19 to 8.21 with
following observations:
-
The conclusions drawn in the analyses of network
A
are more or less similar in case of
network
B
. There is a distinct difference in the results between
NBI
and
I
n
. Already after
five to seven increments, a further increase of network volume does not seem to improve
the network reliability significantly, according to more coherent values of
I
n
.
-
On the other hand, in couple of situations expressed by
NBI
, an instant drop of the value
has been registered before it continues to re-grow, however at lower pace. In the process
of gradual increase of pipe diameters and reduction of pump speed, the supply from the
tank will be covering gradually larger area in each new scenario, until the moment its
elevation/head surpass the head of the pump eventually switching it off. The instant curve
drop therefore indicates that the system continues to operate as a full gravity system and
NBI
will further grow only from pipe diameter increase.


Search WWH ::

Custom Search