Environmental Engineering Reference
In-Depth Information
-
The NBI-values appear to be much more sensitive to the selected terrain configuration
and altitude range, than is the case with
I
n
. That difference however appears to be reduced
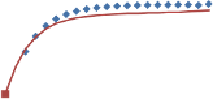
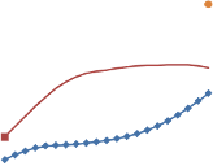
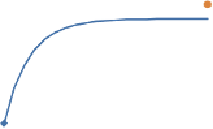
with the increase of altitude range. Figure 8.18, on the left, shows three out of five curves
('Up', 'Hill' and 'Valley') eventually arriving at the shape of those curves on the right,
showing
I
n
. On the other hand, the curves representing the flat- and slope-down terrain
configuration arrive closer to the shape of the volume curve, suggesting a correlation
between the network volume and its reliability, partly discussed in Chapter 7.
-
Consequently, the NBI-values of Up-, Hill- and Valley-topography show rather marginal
increase in the range where the network volume i.e. investment cost starts to grow
significantly, while the trend for Flat- and Down-topography seems to be the opposite.
This difference is not signalled by the values of
I
n
, which all show the same trend,
regardless the terrain configuration.
-
Almost all the results give impression that both networks
A
and
B
reach a certain
maximum reliability measured by
NBI
and
I
n
, which cannot be further exceeded by
additional increase of the volume i.e. at reasonable cost. The NBI-values indicate that this
happens at much more different level of the network volume than is the case with
I
n
, the
exception being the Up-curve in Figure 8.17.
18,000
0.90
18,000
0.90
NBI-A-Low
In-A-Low
16,000
0.80
16,000
0.80
14,000
0.70
14,000
0.70
Vavg
Flat
Up
Down
Hill
Valley
Vavg
Flat
Up
Down
Hill
Valley
12,000
0.60
12,000
0.60
10,000
0.50
10,000
0.50
8,000
0.40
8,000
0.40
6,000
0.30
6,000
0.30
4,000
0.20
4,000
0.20
2,000
0.10
2,000
0.10
-
0.00
-
0.00
1
3
5
7
9
11
13
15
17
19
21
1
3
5
7
9
11
13
15
17
19
21
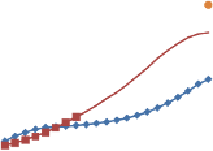
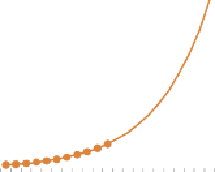
Figure 8.16
Average volume (m
3
) and reliability for 21 scenario of network A at low altitude range
18,000
0.90
18,000
0.90
In-A-Medium
NBI-A-Medium
16,000
0.80
16,000
0.80
14,000
0.70
14,000
0.70
Vavg
Flat
Up
Down
Hill
Valley
Vavg
Flat
Up
Down
Hill
Valley
12,000
0.60
12,000
0.60
10,000
0.50
10,000
0.50
8,000
0.40
8,000
0.40
6,000
0.30
6,000
0.30
4,000
0.20
4,000
0.20
2,000
0.10
2,000
0.10
-
0.00
-
0.00
1
3
5
7
9
11
13
15
17
19
21
1
3
5
7
9
11
13
15
17
19
21
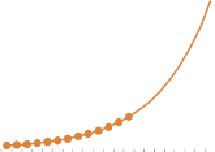
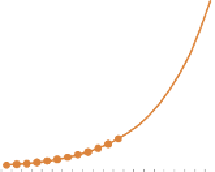
Figure 8.17
Average volume (m
3
) and reliability for 21 scenario of network A at medium altitude range
18,000
0.90
18,000
0.90
NBI-A-High
In-A-High
16,000
0.80
16,000
0.80
14,000
0.70
14,000
0.70
Vavg
Flat
Up
Down
Hill
Valley
Vavg
Flat
Up
Down
Hill
Valley
12,000
0.60
12,000
0.60
10,000
0.50
10,000
0.50
8,000
0.40
8,000
0.40
6,000
0.30
6,000
0.30
4,000
0.20
4,000
0.20
2,000
0.10
2,000
0.10
-
0.00
-
0.00
1
3
5
7
9
11
13
15
17
19
21
1
3
5
7
9
11
13
15
17
19
21
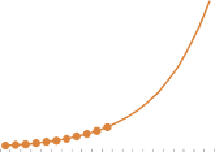
Figure 8.18
Average volume (m
3
) and reliability for 21 scenario of network A at high altitude range


Search WWH ::

Custom Search