Environmental Engineering Reference
In-Depth Information
-
Whilst
NBI
is pretty responsive towards the change of supply conditions, the values of
I
n
do not reflect them; they look pretty similar to those of network
A
. Next to the different
nature of
NBI
and
I
n
, the contributing factor to the difference in results is the demand-
driven (DD) hydraulic calculation used to obtain
I
n
, whilst the
NBI
is calculated by
pressure-driven demand (PDD) calculation. As a consequence, the curves created by the
DD calculation are seemingly more 'neat' but actually less accurate representation of the
network reliability.
8.9
ECONOMIC ASPECTS OF RELIABILITY ANALYSIS
Each of 630 scenarios (two supplying schemes in five different topographies, three altitude
ranges and 21 combinations of pipe diameters and pump speed) was further evaluated on four
different investment and operation cost options given in Table 8.5. The average costs of
investment and operation and maintenance (O&M) per topographic pattern and altitude range
are shown in Figures 8.22 and 8.23.
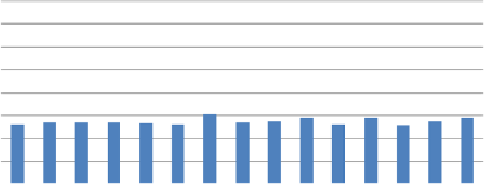
Investment
O&M
1,600,000
1,400,000
1,200,000
1,000,000
800,000
600,000
400,000
200,000
-
Figure 8.22
Average annual costs (US$) of investment and O&M of all A-scenarios
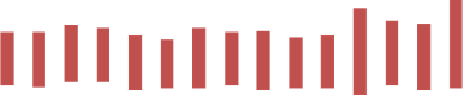
Investment
O&M
1,600,000
1,400,000
1,200,000
1,000,000
800,000
600,000
400,000
200,000
-
Figure 8.23
Average annual costs (US$) of investment and O&M of all B-scenarios


Search WWH ::

Custom Search