Geology Reference
In-Depth Information
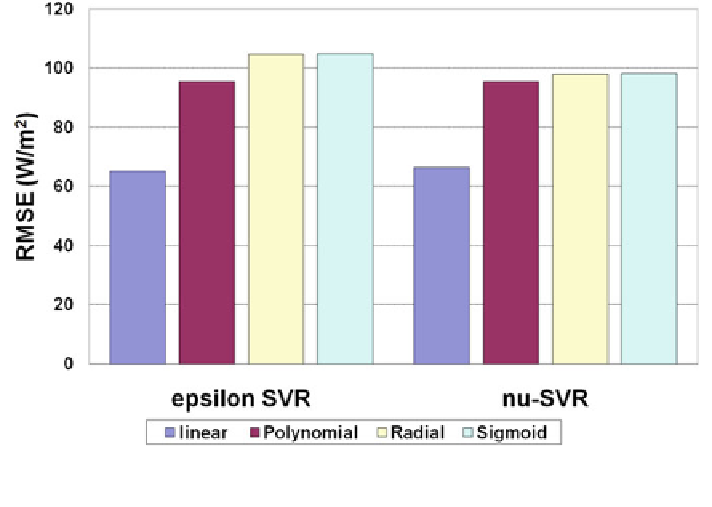
Fig. 7.33 Variation of performance in data-based evaporation modeling at the Chahnimeh
reservoirs region when applying different support vector machines on different kernel functions
polynomial, radial, and sigmoid type kernels. The modeling results are given in
Fig.
7.33
.
Figure
7.33
shows the modeled root mean squared error when using different
combinations on the evaporation data in terms of mean squared errors. This analysis
on daily evaporation data from the Chahnimeh reservoirs was performed after
fixing the parameters to default values (degree in kernel function is set as 3, coef0 in
kernel function is set as zero, cache memory size is set as 40 MB, and tolerance of
termination criterion is set as a default value of 0.001). The analysis results are in
line with what we found in previous modeling case studies. It was found that the
performances of both
-SVM with linear kernel function have shown
better values (minimum) of RMSE. The root mean squared error produced by the
ʵ
-SVM and
ʽ
ʵ
-
SVM was better than that of
-SVM in all kernel functions. The cost value was
chosen to be 2 because it produced least error at that value, with minimum running
time and its better performance in our previous experience. The value of
ʽ
was set to
0.1 for reliable results and less computation time based on our experience in pre-
vious case studies and this analysis. However, the SVM-modeled results were not
that promising compared to LLR and ANFIS models in this case study. The SVM
model (
ʵ
ʵ
-SVR with linear kernel) produced an RMSE of 3.34 mm/day with an
MBE of
ciency of 87.4 % during the training phase,
whereas the corresponding values during the validation phase were 3.67,
−
−
0.0549 mm/day and an ef
0.614 mm/day, and 87.0 % respectively. The statistical performance analysis
showed that SVM slightly underperformed compared to the ANFIS and LLR
models.