Geology Reference
In-Depth Information
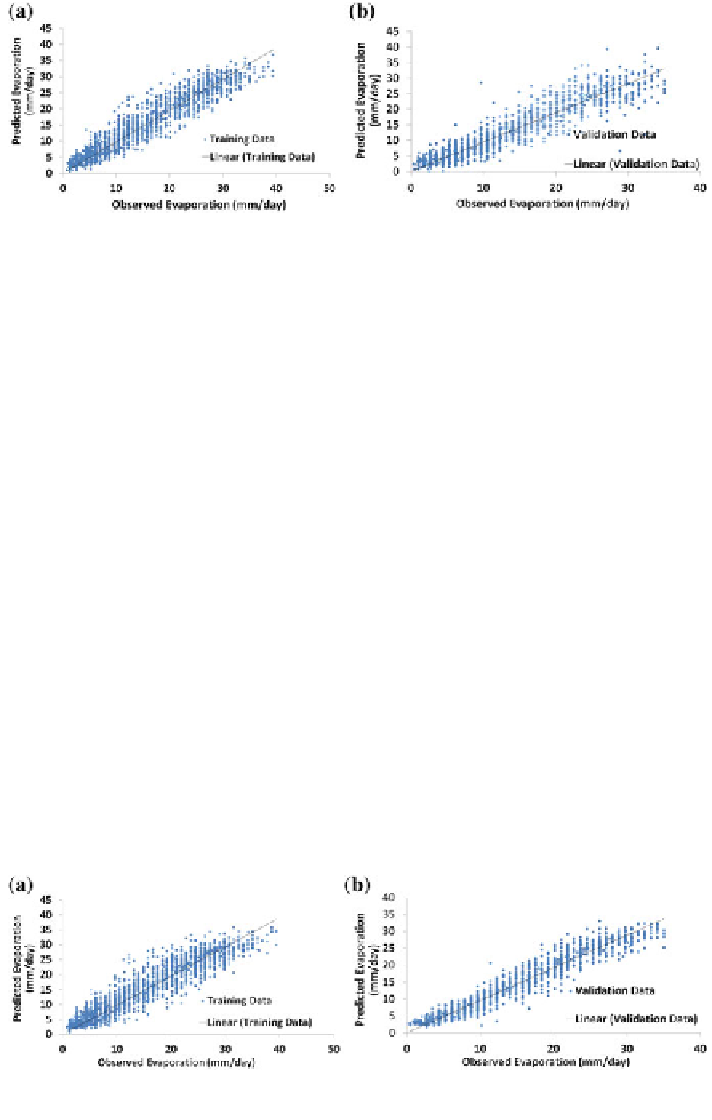
Fig. 7.31 LLR modeled and observed evaporation data at the Chahnimeh reservoirs region:
(a) training data; (b) validation data
were observed for the LLR model with values of 2.755 mm/day, 0.91, 0.97, and
91.4 % for statistical parameters such as RMSE, CORR, slope, and ef
ciency
respectively. The corresponding values for the ANFIS model were 2.96 mm/day,
0.89, 0.98, and 90 % respectively. In contrast, the variance of distribution for ANN-
LM was observed to be higher than that of ANFIS with values 8.874 and 8.76 (mm/
day)
2
, respectively. Both these values are much better than the other two ANNs.
Between ANNs and ANFIS, ANN-LM has a slightly better performance, which
indicates that a fuzzy approach has not helped to outperform abilities of the
Levenberg
Marquardt algorithm to improve the evaporation modeling results.
Whereas the fuzzy approach dealt effectively with Conjugate Gradient and BFGS
algorithms. Figure
7.31
illustrates the scatter plots for the LLR model and the
scatter plots of the ANIFS models are given in Fig.
7.32
.
This section also checked the capability of SVMs in data-based evaporation
modeling, based on the data from the Chahnimeh reservoirs region of Iran. Proper
identi
-
cation of different parameters including cost factors, best regressors, and
kernel functions is very important in SVM modelling. For this purpose, we have
tried different combinations of kernel functions, regressors, and classi
ers to see
which combination is the best. Different SVMs such as
ʵ
-SVR (epsilon type support
vector regressor),
ʽ
-SVR along with different kernel functions such as linear,
Fig. 7.32 ANFIS modeled and observed evaporation data at the Chahnimeh reservoirs region:
(a) training data; (b) validation data