Environmental Engineering Reference
In-Depth Information
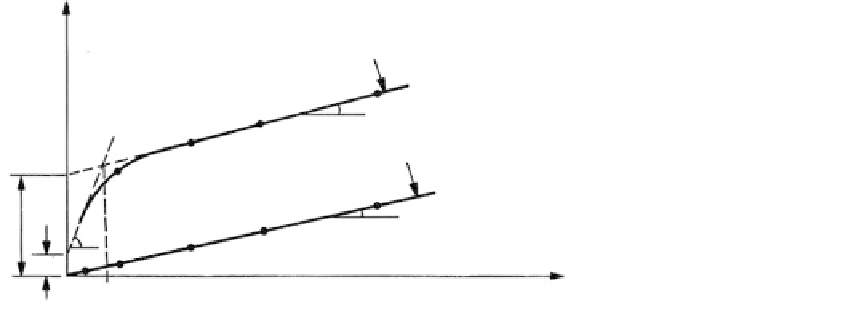
Peak shear strength
b
Residual shear strength
A
C
a
FIGURE 3.44
Shear strength-normalized stress
graph for direct shear test on
rock specimen.
C
′
σ
a
Normal stress
σ
n
and
c
are abstracted from the graph, which often
is a composite of several tests, as shown in Figure 3.44 where
Shear strength parameters
φ
a
,
φ
b
,
φ
r
,
c
φ
residual friction angle.
●
r
a
; point A is a break in the peak shear
strength curve resulting from the shearing off of the major irregularities (asperi-
ties) on the shear surface. Between points O and A,
φ
apparent friction angle below stress
σ
●
a
φ
a
will vary slightly and is
measured at the stress level of interest (
u
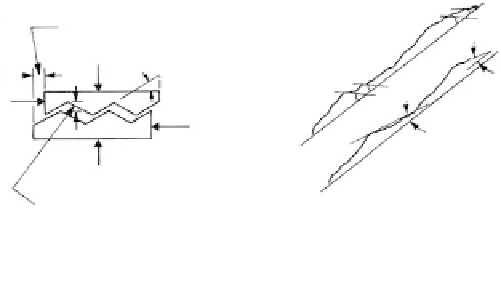
is the friction angle
obtained for smooth surface of rock and angle
j
is the inclination of surface
asperities) (
Figure 3.45)
.
φ
φ
j
where
φ
a
u
φ
the apparent friction angle above stress level
σ
a
; it is usually equal to or
●
b
slightly greater than
φ
r,
and varies slightly with the stress level. It is measured at
the level of interest.
c
cohesion intercept of peak shear strength which may be zero.
●
c
apparent cohesion at a stress level corresponding to
φ
b
.
●
Borehole Shear Test (BST) (ASTM D4917-02)
Purpose
The borehole shear test measures peak and residual values of
and
c in situ
. Initially
developed at Iowa State University by R.L. Handy and N.S. Fox for the U.S. Bureau of
φ
j angles for
second-order
projections
Shear displacement
δ
s
σ
σ
σ
Average j angles
for first-order
projections
σ
Normal displacement
δ
n
δ
n
=
δ
s
tan j
τ
=
σ
N
tan (
+ j)(3.59)
(a)
(b)
FIGURE 3.45
The joint roughness angle
j
: (a) experiments on shearing regular projection and (b) measurements of
j
angles
for first- and second-order projections on rough rock surface. (From Patton, F. D.,
Proceedings of the 1st
International Congress of Rock Mechanics,
Lisbon, Vol. 1, 1966, pp. 509-513. With permission.)