Environmental Engineering Reference
In-Depth Information
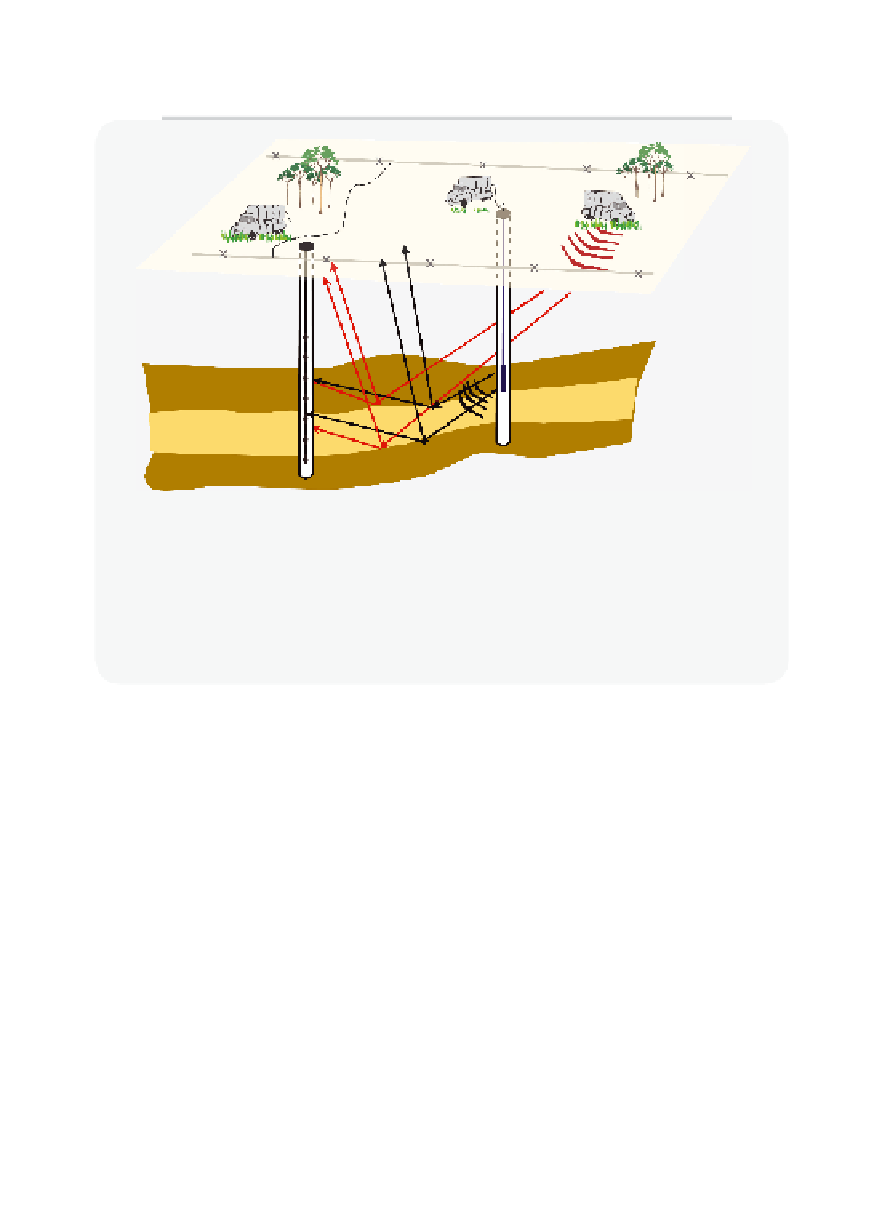
Figure 10.5.2
3D sketch of the ground surface
3D sketch of the ground surface, two wells, and a layered geological structure to illus-
trate the methods of surface and borehole seismic monitoring. Seismic waves can be
induced on the surface (vibroseis truck, red waves and arrows) or in a well by a spinning
eccentric mass (right-hand side well). The signals can be monitored either on the sur-
face or in a well (left-hand side well).
Nonetheless, seismic monitoring is the main approach to large-scale
delineation of CO
2
spreading in the deep subsurface and has been used
successfully to monitor the Sleipner sequestration project that began
injection of CO
2
in 1996.
Figure 10.5.3
shows a 3D sketch of the Sleipner
system in which natural gas with about 9% CO
2
content is produced from
a deep formation, processed at the off-shore platform using amine
scrubbing to remove CO
2
, and then sent by pipeline to market. The sepa-
rated CO
2
is then injected into the shallower Utsira Formation for geologi-
cal carbon sequestration.
Figure 10.5.4
shows a cross-section of seismic refl ections in the
Utsira Formation [10.48]. The darker bands are stronger refl ections indi-
cating large contrast in seismic wave speed due to CO
2
saturation. As
shown, the area of the Utsira saturated with CO
2
increased over time as
CO
2
was injected, migrated upward and spread out underneath the cap-
rock. This is the best subsurface seismic record of a large-scale seques-
tration project. Note that while the data provide strong evidence that CO
2


Search WWH ::

Custom Search