Environmental Engineering Reference
In-Depth Information
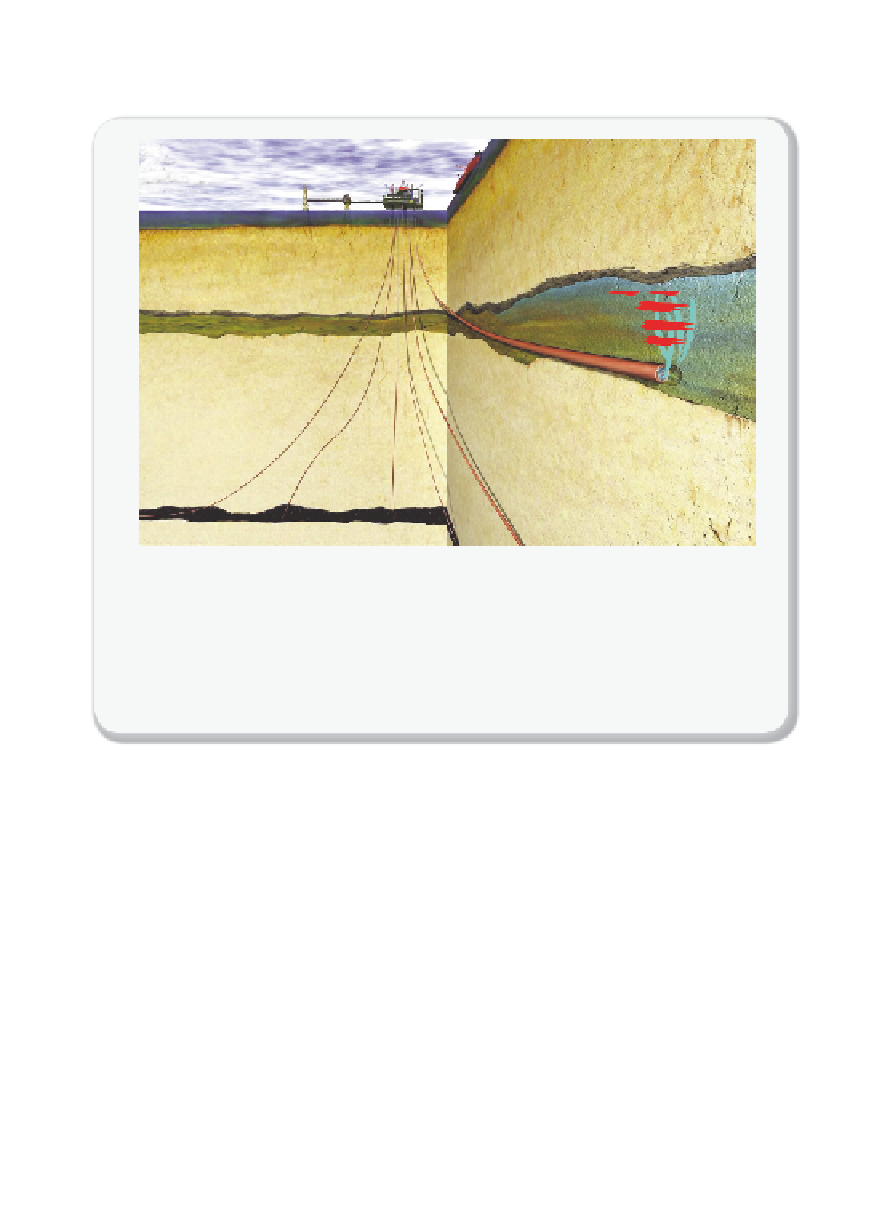
Figure 10.5.3
3D sketch of the injection of CO
2
Sleipner project: 3D sketch of the injection of CO
2
through a horizontal well into a forma-
tion above the one from which natural gas with 9% CO
2
is produced. The light blue
pillars and red broad plumes represent the interpretation of how the buoyant CO
2
is
fi lling the formation in response to repeating discontinuous low-permeability shale layers
(broad plumes) within high-permeability sandstone (pillars).
Graphic by Statoil
.
is occupying the pore space, the resolution in terms of quantifying how
much CO
2
is being stored, and where this storage is occurring, is not all
that high.
An example of higher-resolution seismic monitoring in both space and
time is provided by the Frio CO
2
injection test in the onshore Texas Gulf
Coast region [10.49]. The Frio CO
2
injection test was carried out in two
phases, in 2004 and 2006. Summarizing the test briefl y, 1600 tonnes of
CO
2
were injected over 10 days in 2004 into the Frio Formation at a depth
of about 5,000 feet. In the second phase in 2006, approximately 300
tonnes of CO
2
were injected into a sandstone layer about 400 feet deeper
than the larger injection of the fi rst phase. Seismic sources and receivers
were set up to provide temporal information on CO
2
migration [10.47].
Figure 10.5.5
shows a sketch of the borehole-based seismic sources and
receivers with seismic ray paths, along with a depiction of the sandstone
layers (colored blue and green).
Figure 10.5.5
also shows the successful


Search WWH ::

Custom Search