Environmental Engineering Reference
In-Depth Information
(b)
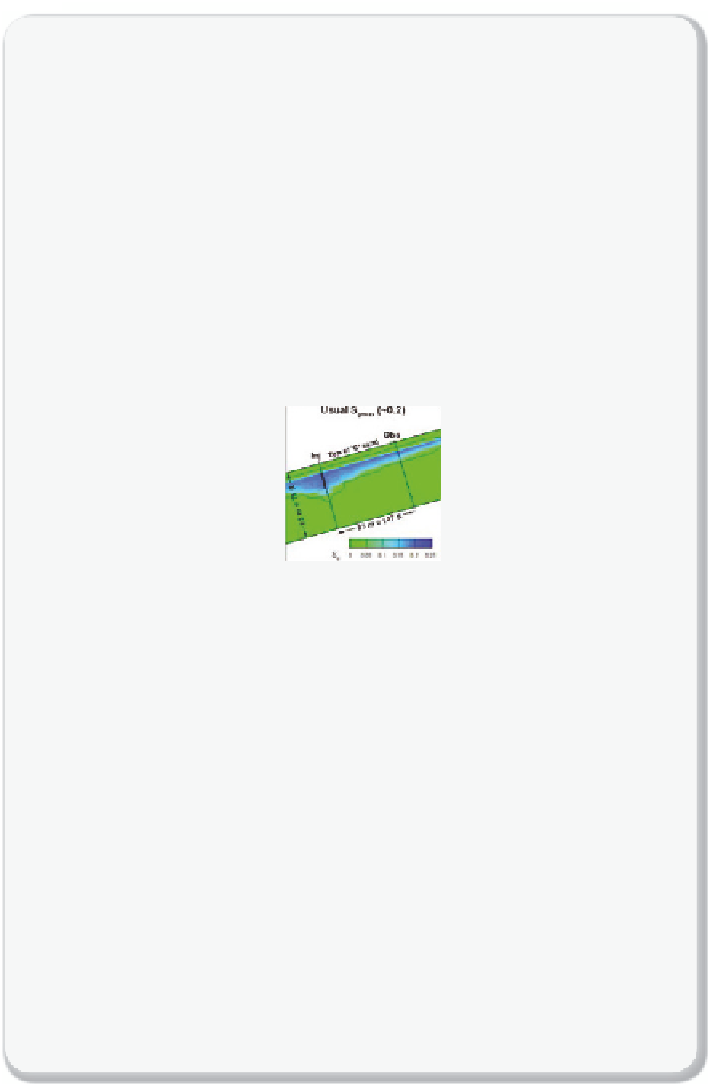
Usual S
grmax
(~0.2)
Half S
grmax
(~0.1)
Obs
Obs
Inj
Inj
S
g
S
g
0 0.05 0.1 0.15 0.2 0.25
0 0.05 0.1 0.15 0.2
(a)
(c)
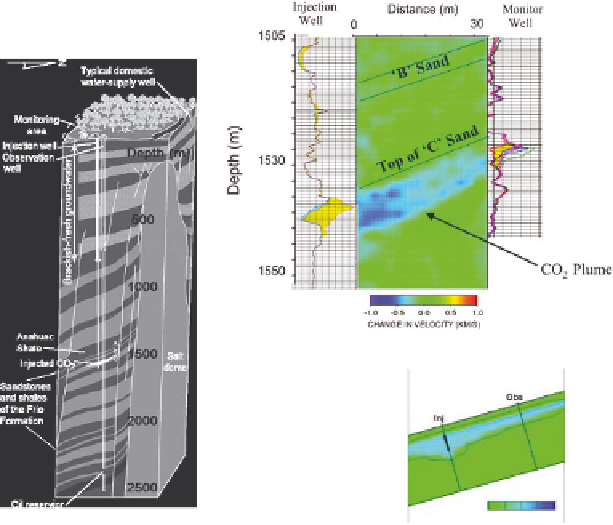
Figure 10.2.2
Sensitivity of fi eld-scale model predictions to residual gas saturation
Illustration of the sensitivity of fi eld-scale model predictions to model input parameters.
(a) Schematic description of the Frio I sequestration pilot site (a sandstone formation near
Houston, Texas, where about 1.6 kilotonne of CO
2
was injected at a depth of 1,530 m).
(b) Experimental data on CO
2
saturation (
S
g
) during the CO
2
injection test; the left and
right sides of the fi gure show
S
g
values (more precisely, changes in resistivity caused by
the presence of CO
2
) measured as a function of depth at the injection (left-hand side)
and observation wells (right-hand side); the central part of the fi gure shows a recon-
struction of CO
2
saturation in the region between the wells from cross-well seismic
measurements (
Figure 10.5.5
).
(c) Model predictions of
S
g
for two different values of the maximum residual gas satura-
tion (
S
g,r,max
=
0.2 or 0.1 on the left-hand and right-hand sides), a model parameter
discussed in more detail in Section 9.7. The model correctly predicts the overall shape
of the CO
2
plume, but not its fi ne structure; model predictions are highly sensitive to
S
g,r,max
, a poorly-constrained input parameter (
Table 9.7.1
).
(a) and (c):
Reproduced from Doughty et al.
[10.3]
.
(b):
Reproduced from Daley et al.
[10.2]
. All fi gures reproduced with kind permission from Springer Science + Business
Media.


Search WWH ::

Custom Search