Environmental Engineering Reference
In-Depth Information
0.8
Observed
0.7
0.6
Predicted
0.5
0.4
0.3
0.2
0.1
0.0
0
2
6
4
t
(10
2
days after CO
2
injection)
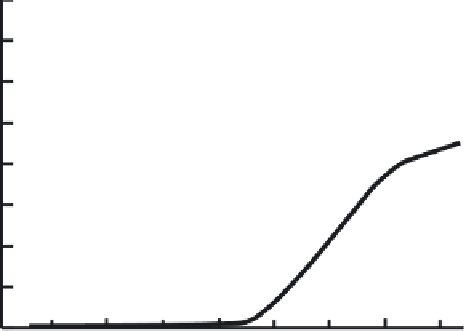
Figure 10.2.1
Blind prediction of data from a pilot site
Blind prediction of fi eld-scale sequestration data from the CO2CRC Otway pilot site in
Australia, where 65 kilotonne of CO
2
was injected into a depleted gas reservoir. The
graph shows predicted and measured values of CO
2
saturation,
S
g
, as a function of time
at an observation well along the path of the CO
2
plume. The increase in CO
2
saturation
indicates the arrival of the CO
2
plume at the observation well.
Figure redrawn from
Underschultz et al.
[10.1].
that existing fi eld-scale carbon sequestration models yield useful qualita-
tive information on the behavior of CO
2
in geological formations but large
uncertainties are manifested in their quantitative predictions of basic
properties, such as the velocity of the CO
2
plume or the rates of various
CO
2
trapping mechanisms.
The quality of fi eld-scale model predictions depends on two features:
the design of the model, which must account for all relevant physical
phenomena, and the input parameters of the model, which must accu-
rately describe fundamental properties such as the CO
2
-brine equation of
state and specifi c properties of the rock formations, such as their perme-
ability. A model may fail to predict the fate of CO
2
because of inaccura-
cies in its design or because of a poor choice of input parameters. In the
case of carbon sequestration, both potential sources of inaccuracy pre-
sent signifi cant challenges: geological formations are complex sites


Search WWH ::

Custom Search