Civil Engineering Reference
In-Depth Information
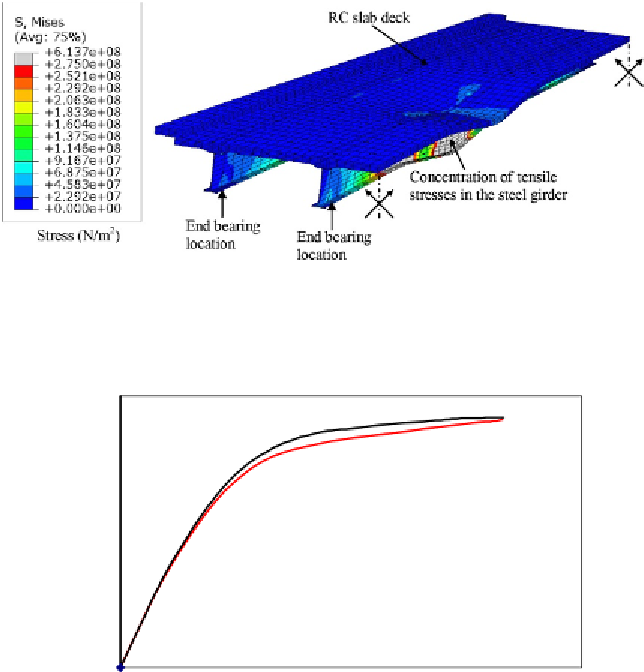
Figure 7.21 Stress (von Mises) contours at failure of the composite bridge (enlarged
10times).
6000
5000
4000
3000
2000
1000
Test
FE
0
0
50
100
150
200
250
300
350
400
450
500
Deflection (mm)
Figure 7.22 Load-deflection relationship of the steel girder at section C-C obtained
experimentally and numerically.
midspan in the lower flange of the steel beam. The load-midspan deflection
curves predicted experimentally and numerically were compared as shown
in
Figure 7.22
.
It can be shown that generally good agreement was achieved
between experimental and numerical relationships. The ultimate failure load
observed in the test [
7.31
] was 5475.8 kN at a deflection of 414 mm, while
the ultimate failure load predicted from the finite element analysis was
5525.5 kN at a deflection of 415.2 mm. The finite element failure load
was 0.91% higher than that observed in the test.


Search WWH ::

Custom Search