Civil Engineering Reference
In-Depth Information
The softening stress-strain response, past the maximum tensile stress, was
represented by a linear line defined by the fracture energy and crack band
width. The fracture energy
G
f
(energy required to open a unit area of crack)
QUS manual [1.29]. The fracture energy divided by the crack band width
was used to define the area under the softening branch of the tension part of
the stress-strain curve. The crack band width was assumed as the cubic root
of the volume between integration points for a solid element, as recom-
mended by CEB [
7.30
]. The reinforcement bars used in the concrete slab
option) available in the ABAQUS [1.29] element library. Further details
regarding the damaged plasticity model and the modeling of reinforcement
bars can be found in Sections 5.4.3.2 of
Chapter 5
in this topic.
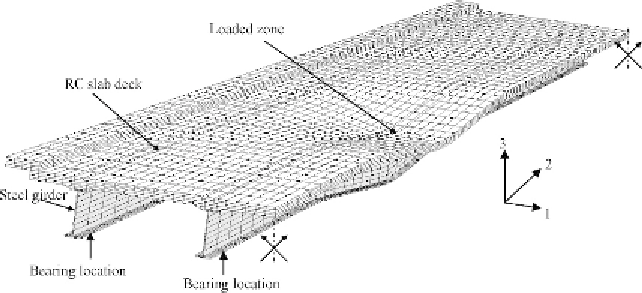
The developed finite element model for the composite bridge (see
Fig-
ure loads, failure modes, and load-midspan deflection curves obtained
experimentally and numerically using the finite element model were com-
pared. The deformed shapes of the composite bridge at failure predicted
numerically are shown in
Figure 7.18
, which is in good agreement with
observed experimentally and confirmed numerically was steel yielding
(SY) in the bottom flange of the steel beam. The data obtained from ABA-
QUS [1.29] have shown that the von Mises stresses at the maximum stressed
fibers at the bottom flanges of the steel beam at midspan exceeded the mea-
sured yield stress. On the other hand, the stresses in the concrete slab at
Figure 7.18 Deformed shape at failure of the composite bridge (enlarged 10 times).
Search WWH ::

Custom Search