Civil Engineering Reference
In-Depth Information
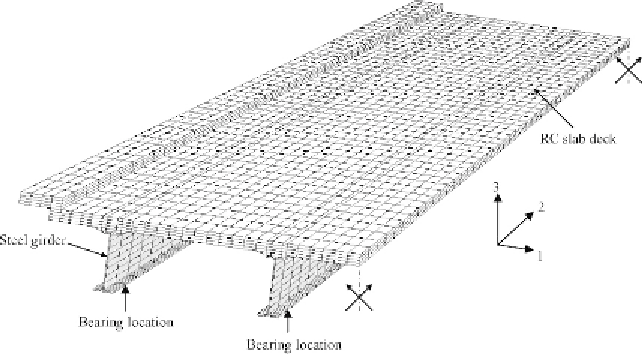
Figure 7.17 Finite element mesh of half of the composite bridge.
of the headed studs. On the other hand, the vertical pressure between the
concrete slab and the steel beam was simulated by vertical rigid springs with
high stiffness in direction 3-3 at the locations of the headed studs. The steel
beam-concrete slab interface was modeled by interface elements available
within the ABAQUS [1.29] element library. The stress-strain curves for
the structural steel and reinforcement bars given in the EC3 [2.11] and
EC2 [2.27], respectively, were adopted for the finite element model of
the composite bridge with measured values of the yield stress and ultimate
[1.29] (using the PLASTIC option) allows a nonlinear stress-strain curve
to be used (see Section 5.4.2 of
Chapter 5
in this topic). The first part of
the nonlinear curve represents the elastic part up to the proportional limit
stress with Young's modulus of (
E
) 200 GPa and Poisson's ratio of 0.3 that
were used in the finite element model.
Concrete was modeled using the damaged plasticity model implemented
in the ABAQUS [1.29] material library. Under uniaxial compression, the
response is linear until the value of proportional limit stress is reached which
is assumed to equal 0.33 times the design compressive strength. Under uni-
axial tension, the stress-strain response follows a linear elastic relationship
until the value of the failure stress. The tensile failure stress was assumed
to be 0.1 times the compressive strength of concrete which is assumed to
be equal to 0.67 times the measured concrete cube strength. The concrete
cube strength is assumed to be equal to 1.25 the concrete cylinder strength.
Search WWH ::

Custom Search