Civil Engineering Reference
In-Depth Information
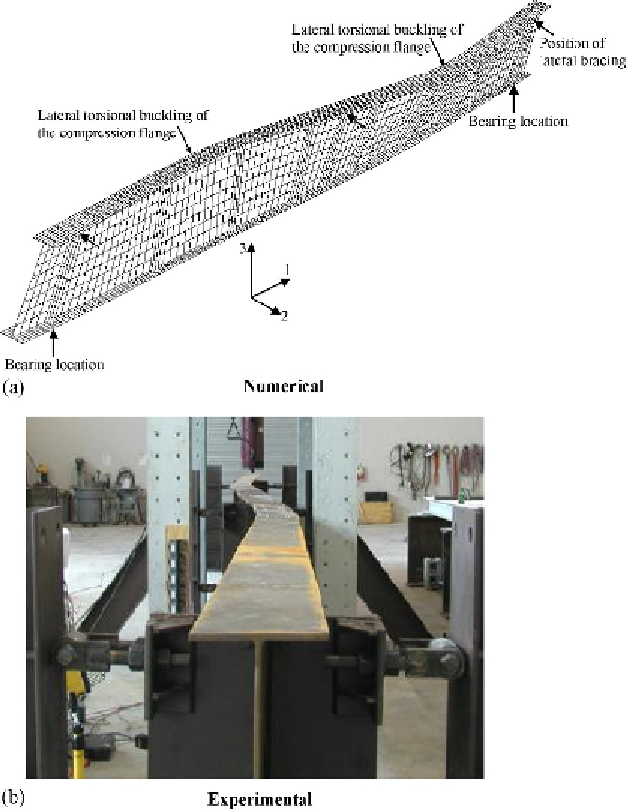
Figure 6.20 Comparison of experimental and numerical deformed shapes at failure of
the full-scale built-up I-section plate girder T3.
girder T3 are plotted. It can be seen that the yield stresses were not reached.
The load-midspan deflection curves predicted experimentally and numeri-
cally were also compared as shown in
Figure 6.24
.
It can be shown that gen-
erally good agreement was achieved between experimental and numerical
Search WWH ::

Custom Search