Civil Engineering Reference
In-Depth Information
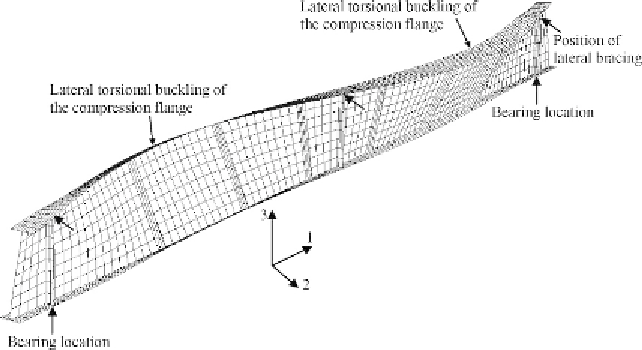
Figure 6.19 Elastic lateral buckling mode (eigenmode 1) for the full-scale built-up
I-section plate girder T3.
nonlinear analysis of
the plate girder T3 following the eigenvalue
prediction.
The developed finite element model for the plate girder T3 (see
Figure 6.18
) was verified against the test results detailed in [
6.8
]
. The failure
loads, failure modes, and load-midspan deflection curves obtained experi-
mentally and numerically using the finite element model were compared.
The deformed shapes of plate girder T3 at failure observed experimentally
and numerically were compared as shown in
Figure 6.20
.
It can be seen that
the experimental and numerical deformed shapes are in good agreement.
The failure mode observed experimentally and confirmed numerically
was lateral-torsional buckling. The data obtained from ABAQUS [1.29]
have shown that the von Mises stresses at the maximum stressed fibers at
the top and bottom flanges at midspan were not exceeded. In
Figure 6.21
,
the stress (principal stresses in direction 1-1) contours at failure of the full-
scale built-up I-section plate girder T3 are plotted. It can be seen that the
yield stresses were not reached. In addition, in
Figure 6.22
, the plastic strain
(principal strains in direction 1-1) contours at failure of the small-scale built-
up I-section plate girder T3 are plotted. Once again, it can be seen that the
plastic strains were not reached. Furthermore, in
Figure 6.23
,
the von Mises
yield stress contours at failure of the small-scale built-up I-section plate
Search WWH ::

Custom Search