Civil Engineering Reference
In-Depth Information
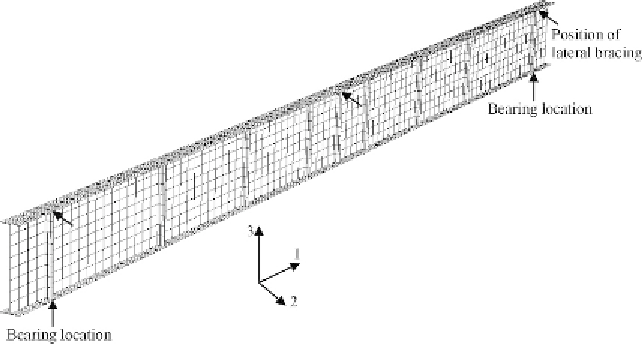
Figure 6.18 Finite element mesh of the full-scale built-up I-section plate girder T3.
at midspan, which is identical to the test T3. The load was applied in incre-
ments as concentrated static load using the RIKS method (see Section 5.5.4 of
Chapter 5
) that is also identical to the experimental investigation. The non-
linear geometry was included to deal with the large displacement analysis.
The stress-strain curve for the structural steel given in the EC3 [2.11] was
adopted in this study with measured values of the yield stress (
f
ys
) and ulti-
ABAQUS [1.29] (using the PLASTIC option) allows a nonlinear stress-
strain curve to be used (see Section 5.4.2 of
Chapter 5
). The first part of
the nonlinear curve represents the elastic part up to the proportional limit
stress with Young's modulus of (
E
) 200 GPa and Poisson's ratio of 0.3 used
in the finite element model. Since the buckling analysis involves large inelas-
tic strains, the nominal (engineering) static stress-strain curves were con-
verted to true stress and logarithmic plastic true strain curves as detailed
in Section 5.4.2.
to model initial geometric imperfections of the plate girder investigated
T3. In
Figure 6.19
, the buckling mode predicted from the eigenvalue buck-
ling analysis detailed in ABAQUS [1.29] is shown. Only the first buckling
mode (eigenmode 1) is used in the eigenvalue analysis. Since buckling
modes predicted by ABAQUS eigenvalue analysis [1.29] are generalized
to 1.0, the buckling modes are factored by a magnitude of
L
u
/1000, where
L
u
is the length between points of effective bracing. The magnitude of
Search WWH ::

Custom Search