Civil Engineering Reference
In-Depth Information
The reinforcement bars were modeled with a yield stress of 460 MPa and
initial Young's modulus of 200 GPa, as measured by Ellobody [2.68] using
the same bilinear curve as shown in
Figure 5.34
.
The developed finite element models [2.71] were verified against the
pushout tests [2.57-2.59]. The shear connection capacity per stud obtained
from the tests (
P
Test
) and finite element analysis (
P
FE
) and the load-slip
behavior of the headed shear stud and failure modes have been investigated.
It was shown that good agreement has been achieved between both results
for most of the pushout tests. A maximum difference of 7% was observed
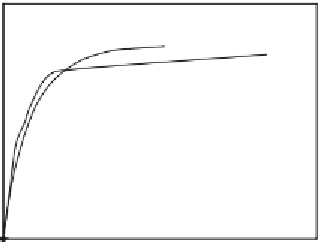
between experimental and numerical results. The experimental load-slip
curve obtained for pushout test specimens [2.58, 2.59] was compared with
the numerical curve obtained from the finite element analysis, as shown in
Figure 5.35
. Generally, good agreement has been achieved between exper-
imental and numerical load-slip curves. It is shown that the finite element
models successfully predicted the shear connection capacity and stiffness
as well as load-slip behavior of the headed shear stud. The maximum load
per stud recorded experimentally was 39.2 kN at a slip of 2.1 mm compared
with 40.9 kN and 1.3 mm, respectively, obtained from the finite element
analysis. The failure mode observed experimentally for pushout specimen
[2.58, 2.59] was compared with that predicted numerically. The failure
mode was a combination of concrete conical failure and stud shearing as
observed experimentally and confirmed numerically.
Figure 5.36
showed
the stress contour at failure for pushout specimen tested in [2.58, 2.59]
and modeled in [2.71]. It should be noted that the maximum stresses in
50
40
30
20
FE
Test (Kim
et al.
)
10
0
0
0.5
1
1.5
2
2.5
Slip (mm)
Figure 5.35 Load per stud versus slip for pushout specimen tested in [2.58, 2.59] and
modeled in [2.71].


Search WWH ::

Custom Search