Civil Engineering Reference
In-Depth Information
occurred even at a low load level. According to this observation, the nodes
behind the stud, in the direction of loading, are detached from the surround-
ing concrete nodes with the other nodes of the stud connected with the sur-
rounding concrete. All nodes of the concrete slab and profiled steel sheeting
in the opposite direction of loading (surface 1 in
Figures 5.32
and
5.33
)
are
restricted from moving in the
Z
-direction to resist the applied compression
load. All nodes along the middle surface of the steel beam (surface 2) are
restricted from moving in the
X
-direction due to symmetry. All concrete
nodes, profiled steel sheeting nodes, reinforcement bar nodes, steel beam
flange nodes, steel beam web nodes, and headed stud nodes that lie on
the other symmetry surface (surface 3) are restricted from moving in the
Y
-direction because of symmetry. Following the testing procedures con-
ducted in [2.57-2.59], the load was applied in increments as static uniform
load using the RIKS method available in the ABAQUS library. To model
the nonlinear behavior of the concrete slab, the yielding part of the concrete
stress-strain curve, which is the part after the proportional limit stress, is trea-
ted by the Drucker-Prager yield criterion model available in the ABAQUS
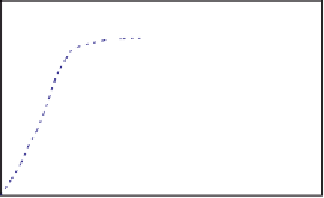
[1.29] material library. The measured stress-strain curve by Ellobody [2.68]
bilinear stress-strain model. The stud material behaved as linear elastic mate-
rial with Young's modulus (
E
s
) up to the yield stress of the stud (
f
ys
), and after
this stage, it becomes fully plastic. The Young's modulus and yield stress of
the stud are taken as 200 GPa and 470.8 MPa. The steel beam and profiled
steel sheeting were modeled with yield stresses of 288 and 308 MPa and ini-
tial Young's modulus of 189 and 184 GPa, respectively, as measured by Kim
et al.
[2.58, 2.59] using the same bilinear curve as shown in
Figure 5.34
.
600
500
400
300
200
Test
Bilinear
100
0
0
0.2
0.4
0.6
0.8
1
Strain (%)
Figure 5.34 Measured and simulated stress-strain curves of stud presented by Ellobody
[2.68].


Search WWH ::

Custom Search