Biology Reference
In-Depth Information
Dynamics of Gene Expression
1.11
1.1
1.09
1.08
P190
P210
1.07
1.06
1.05
1.04
1234567891011121314151617181920
Chromosomes
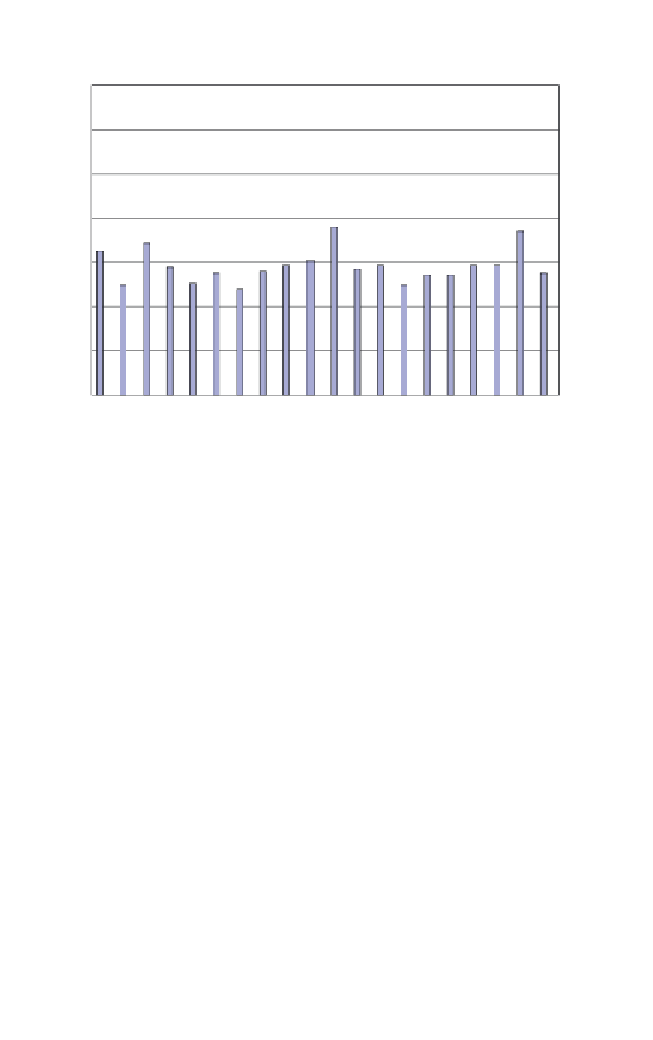
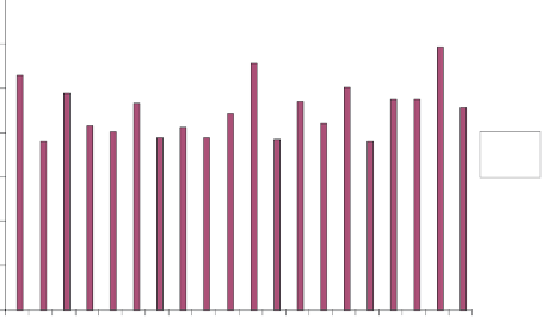
Fig. 5.2.
Average gene expression changes on each chromosome.
5.1.3.3.
Absolute difference between P190
and P210 (Fig. 5.3)
(
∑
|
e
p190
(
i
,
j
) −
e
p210
(
i
,
j
)|
)
/
n
(
j
).
Absolute difference (
j
)
=
Here,
e
(
i
,
j
) are expression fold changes and
n
(
j
) are the numbers of genes
in every chromosome group;
j
1, 2, … ,
n
(
j
).
We find that the No. 4 chromosome has the highest differential expres-
sion across the two datasets.
=
1, 2, … , 20;
i
=
5.1.3.4.
Prefiltering process (gene selection)
There were only a small number of genes in the P190 and P210 datasets
that were differentially expressed across the two datasets. Genes with
lower standard deviations across the two samples were removed. A total
of 8832 genes in the P190/P210 data set were selected, the deviation
ranging from 2 to 6.68.


Search WWH ::

Custom Search