Biology Reference
In-Depth Information
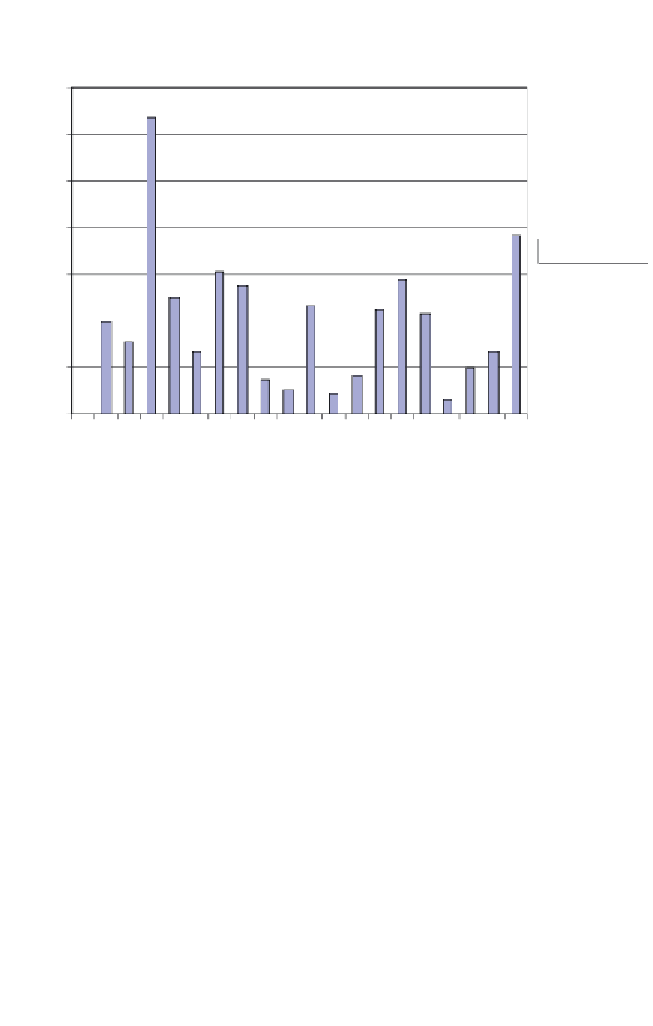
Difference between P190 and P210
0.14
0.12
0.1
0.08
|P190-P210|
0.06
0.04
0.02
0
1357913579
Chromosomes
Fig. 5.3. Difference in expression levels between P190 and P210 for genes on each
chromosome.
The deviation is defined as follows:
D
(
i
)
=
|
e
p190
(
i
)
−
e
p210
(
i
)|
i
=
1, 2, … , 21934,
where
D
(
i
) is the deviation of the
i
th gene, and
e
p190
(
i
) and
e
p210
(
i
) are the
expression levels of the
i
th gene for P190 and P210, respectively.
The data were sorted from low to high according to the deviation value
across the two samples. The distribution of all the genes is shown in
Fig. 5.4. There are two very sharp jumps in the curve, one in the middle
and another near the end.
The first jump occurs at number 13 102 (see Fig. 5.5). The deviation
changes from about 0 to 2. This fact clearly indicates that about two
thirds of the 21 934 genes are not significant at all. Therefore, only 8832
genes are selected for further analysis.


Search WWH ::

Custom Search