Biology Reference
In-Depth Information
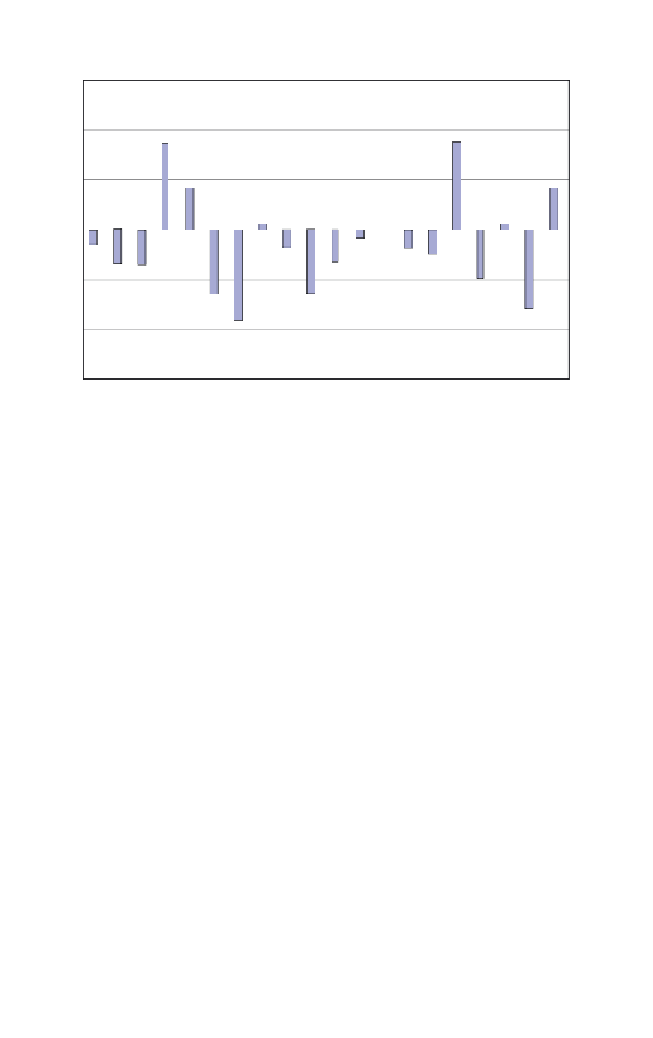
Average Fold Change based on Chromosome groups
0.15
0.1
0.05
P190
P210
0
12345678910111213 4 5 6 7 8 9 0
-0.05
-0.1
-0.15
Chromosomes
Fig. 5.1.
Genes altered by P190 or P210 BCR-ABL on each mouse chromosome.
The No. 4 chromosome shows the strongest changes in two ways. One
is that most genes in P190 are upregulated and most genes in P210 are
downregulated, while in many other chromosome groups both P190 and
P210 move in the same direction. Another finding is that the absolute
change of genes on the No. 4 chromosome is the biggest among the
20 chromosomes.
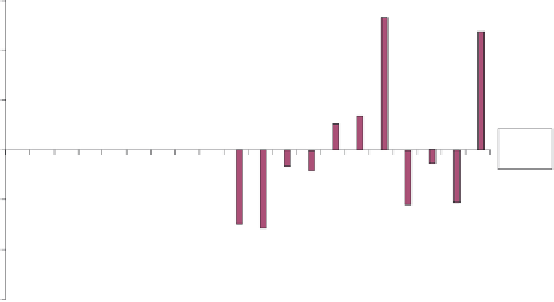
5.1.3.2.
Dynamics of gene expression
In order to enhance the signal-to-noise ratio (SNR), the dynamics of all
gene expression levels were calculated. Figure 5.2 shows that P210
signals are uniformly stronger than the P190 signals, which can be treated
as system errors and can be balanced out easily if necessary.
(
∑
|
e
(
i
,
j
)|
)
/
n
(
j
).
Average absolute change (
j
)
=
Here,
e
(
i
,
j
) are expression fold changes and
n
(
j
) are the numbers of genes
in every chromosome group;
j
=
1, 2, … , 20;
i
=
1, 2, … ,
n
(
j
).


Search WWH ::

Custom Search